


Overview
This topic discusses the chart's coordinate system, as well as some techniques for using GDI+ functions to perform custom drawing.
2D Charts
The chart coordinate system has its origin in the upper-left corner with the X axis pointing to the right and the Y axis pointing down (see Figure 1). The unit of measure is a percentage of the chart picture's width and height, and coordinate values should be between 0 and 100%. By using relative coordinates we make sure that objects remain relative to one another if the chart is resized.
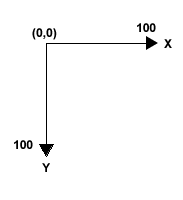
Figure 1: Coordinate system.
There are two chart elements that use this coordinate system; the legend (represented by the Legend object); and all chart areas (each one represented by the ChartArea object). The positioning of these objects is accomplished through the use of their Position properties.
When setting the position of a plotting area inside of a chart area a different coordinate system is used. Coordinate 0,0 represents the top-left corner of the ChartArea object, and 100,100 represents the bottom-right corner of the ChartArea object. The same applies to the Legend object, but only when it is plotted inside of a chart area.
3D Charts
The 3D chart coordinate system is the same as the 2D chart (see above), with the only difference being the addition of Z axis coordinates. Like the X and Y axes Z coordinates are relative, with the backwall of a chart area having a Z value of 0, and the front wall of a chart area having a Z value of 100.
Custom Drawing
To perform custom drawing using GDI+ functions it is necessary to convert relative coordinates to absolute pixel coordinates. When absolute coordinates are used the top-left corner of a relevant chart element (chart image, legend or chart area) is at position "0,0" and the bottom-right corner is defined by the width and height of the rectangle in pixels (e.g. "width in pixels,height in pixels"). The Chart control comes with a ChartGraphics class that eases this conversion, and allows for absolute-to-relative and relative-to-absolute conversion of PointF, RectangleF and SizeF structures.
For more information on the coordinate system, see the topic on Custom Drawing Using Paint Events.