Overview
You can perform any custom drawing in your charts by using the GDI+ functions in concert with the PostPaint or PrePaint events. These two events fire when different elements of the chart like the chart image, chart area , legends, and series are drawn. The PrePaint event fires prior to the painting of an element, and PostPaint event fires after the painting is complete.
 Note Note |
| These events do not fire for Series objects within 3D chart types. |
Using the PrePaint and PostPaint Events
When PrePaint or PostPaint events fire, the event's sender object, and a ChartPaintEventArgs object are passed as arguments. The sender's instance type can be checked to detect which element of the chart fired the event. This type of event may be fired by a ChartPicture object (which represents the entire chart image), a ChartArea object, a Series object, or even a Legend object.
Example
This example demonstrates how to check to see if the chart element that raised the event is a ChartArea object named "Default".
| Visual Basic |
 Copy Code Copy Code |
Imports Dundas.Charting.WebControl
   ...

Private Sub Chart1_PostPaint(ByVal sender As Object, ByVal e As ChartPaintEventArgs)
   ...

  If (sender = ChartArea) Then
    Dim area As ChartArea = CType(sender,ChartArea)
    If (area.Name = Default) Then
      ...
    End If
  End If
    ...
End Sub
|
| C# |
Copy Code |
using Dundas.Charting.WebControl;
   ...

private void Chart1_PostPaint(object sender, ChartPaintEventArgs e){
  ...

  if(sender is ChartArea)
  {
    ChartArea area = (ChartArea)sender;
    if(area.Name == Default)
    {
      ...
    }
  }
    ...
}
|
| Note |
| The chart type, and the existence of data point markers, determines how often these events fire (i.e. the paint events may fire more than once for a chart element). To make sure that code executes once, and only once, use a boolean flag to control its execution. Set the flag after the code executes, and reset it in the PostPaint event for the ChartPicture object. |
For more information on optimizations while using events, see the topic on Performance and Optimization.
The ChartPaintEventArgs Object
The ChartPaintEventArgs object has three important properties
-
A Position property that allows for positioning of a relevant chart element.
-
A ChartGraphics object property that exposes a GDI+ Graphics object, used to facilitate GDI+ drawing operations. This object also exposes several methods used for coordinate conversion (the chart uses relative coordinates, but GDI+ functions must use absolute coordinates. Refer to the topic on the Chart Coordinate System for further details).
| Note |
| 3D chart axis values cannot be converted to absolute values directly, they must first be converted to Point3D objects, and then transformed from there. For more information on transforming 3D point values, as well as custom drawing for 3D charts, see the topic on Working with 3D Charts. |
- A Chart property, that represents the root Chart object.
Example
This example demonstrates how to perform a GDI+ drawing operation to draw an ellipse on top of the chart area using a semi transparent custom color as shown in Figure 1 below. A post paint event is used to draw on the chart area. We assume that a column chart series has been added to the control at design-time, along with data points. Finally, we assume that a DundasBlue template has been used. The event handler is not shown here in this sample.
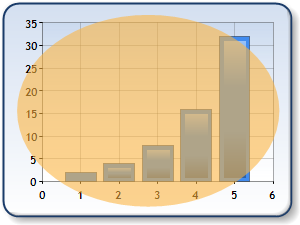
Figure 1: Custom drawing an ellipse.
| Visual Basic |
Copy Code |
Imports Dundas.Charting.WebControl
  ...

Private  Sub Chart1_PostPaint(ByVal sender As Object, ByVal e As Dundas.Charting.WebControl.ChartPaintEventArgs)
    ' Chart Graphics object.
    Dim graphics As ChartGraphics =  e.ChartGraphics

    ' Check to see what chart element fired the event.
    If TypeOf sender Is ChartArea Then
        Dim area As ChartArea = CType(sender, ChartArea)
        ' Check the ChartArea name, and only perform drawing for the "default" area.
        If area.Name = "Default" Then
            ' Find relative Chart Area position.
            Dim relativeAreaPosition As RectangleF =  area.Position.ToRectangleF()
            ' Recalculate Absolute Chart Area position.
            Dim areaRectangle As RectangleF =  graphics.GetAbsoluteRectangle(relativeAreaPosition)
            ' Use GDI+ Graphics object to draw ellipse.
            graphics.Graphics.FillEllipse(New SolidBrush(Color.FromArgb(150,252,180,65)),areaRectangle)
        End If
    End If
End Sub
|
| C# |
Copy Code |
using Dundas.Charting.WebControl;
  ...

private void Chart1_PostPaint(object sender, Dundas.Charting.WebControl.ChartPaintEventArgs e)
{
    // Chart Graphics object.
    ChartGraphics graphics = e.ChartGraphics;

    // Check to see what chart element fired the event.
    if (sender is ChartArea)
    {
        ChartArea area = (ChartArea)sender;
        // Check the ChartArea name, and only perform drawing for the "default" area.
        if (area.Name == "Default")
        {
            // Find relative Chart Area position.
            RectangleF relativeAreaPosition = area.Position.ToRectangleF();
            // Recalculate Absolute Chart Area position.
            RectangleF areaRectangle = graphics.GetAbsoluteRectangle(relativeAreaPosition);
            // Use GDI+ Graphics object to draw ellipse.
            graphics.Graphics.FillEllipse(new SolidBrush(Color.FromArgb(150, 252, 180, 65)), areaRectangle);
        }
    }
}
|
Example
A common chart procedure is to display custom images, text, etc. at a location that is dependent on where data points are drawn. To facilitate this the ChartGraphics class has the GetPositionFromAxis method, which can be used to get a relative position based on data point values. This relative position can then be converted to an absolute pixel position using one of the GetAbsolute methods.
This example demonstrates how to retrieve an absolute pixel position using values from axes as shown in Figure 2 below. A post paint event is used to draw on the chart area. We assume that a column chart series has been added to the control at design-time, along with data points. Finally, we assume that a DundasBlue template has been used. The event handler is not shown here in this sample.
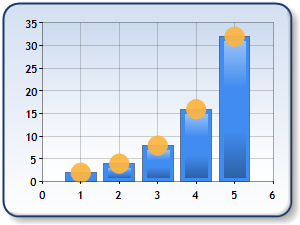
Figure 2: Drawing custom shapes for data points.
| Visual Basic |
Copy Code |
Imports Dundas.Charting.WebControl
  ...

Private  Sub Chart1_PostPaint(ByVal sender As Object, ByVal e As Dundas.Charting.WebControl.ChartPaintEventArgs)

' Chart Graphics object.
Dim graphics As ChartGraphics =  e.ChartGraphics

' Check what chart element fired the event.
If TypeOf sender Is Series Then
      Dim series As Series = CType(sender, Series)
      ' Check the Series name.
      If series.Name = "Series1" Then
          Dim xValue As Double
          Dim yValue As Double
          ' Data points loop.
          Dim point As DataPoint
          For Each point In series.Points
              ' Get relative position of the point that will be the center of the ellipse.
              xValue = graphics.GetPositionFromAxis("Default", AxisName.X, poInteger.XValue)
              yValue = graphics.GetPositionFromAxis("Default", AxisName.Y, poInteger.YValues(0))

              ' Get absolute point.
              Dim absPoint As PointF =  graphics.GetAbsolutePoint(New PointF(CType(xValue,CType(yValue, float, single))))

              ' Use GDI+ Graphics object to draw ellipse.
              graphics.Graphics.FillEllipse(New SolidBrush(Color.FromArgb(150, 252,180,65)),
              absPoInteger.X - 10,
              absPoInteger.Y - 10,
              20,
              20)
          Next
      End If
End If

End Sub
|
| C# |
Copy Code |
using Dundas.Charting.WebControl;
  ...

private void Chart1_PostPaint(object sender, Dundas.Charting.WebControl.ChartPaintEventArgs e)
{

// Chart Graphics object.
ChartGraphics graphics = e.ChartGraphics;

   // Check what chart element fired the event.
   if (sender is Series)
   {
      Series series = (Series)sender;
      // Check the Series name.
      if (series.Name == "Series1")
      {
          double xValue;
          double yValue;
          // Data points loop.
          foreach (DataPoint point in series.Points)
          {
              // Get relative position of the point that will be the center of the ellipse.
              xValue = graphics.GetPositionFromAxis("Default", AxisName.X, point.XValue);
              yValue = graphics.GetPositionFromAxis("Default", AxisName.Y, point.YValues[0]);

              // Get absolute point.
              PointF absPoint = graphics.GetAbsolutePoint(new PointF((float)xValue, (float)yValue));

              // Use GDI+ Graphics object to draw ellipse.
              graphics.Graphics.FillEllipse(new SolidBrush(Color.FromArgb(150, 252,180,65)),
              absPoint.X - 10,
              absPoint.Y -10,
              20,
              20);
          }
      }
   }

}
|
Example
This example demonstrates how to draw several circles around the price value of "Product F" using the PrePaint event. This sample code creates the custom drawing in Figure 3 shown below. We assume that a line chart series has been added to the control at design-time, along with data points. Finally, we assume that a DundasBlue template has been used. The event handler is not shown here in this sample.
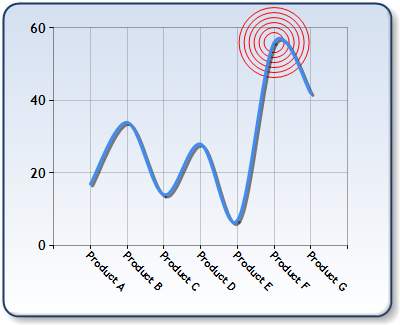
Figure 3: A chart with custom drawn circles.
| Visual Basic |
Copy Code |
Imports Dundas.Charting.WebControl
   ...

Private  Sub chart1_PrePaint(ByVal sender As Object, ByVal e As ChartPaintEventArgs)
            If TypeOf sender Is ChartImage Then
                Dim position As PointF =  PointF.Empty
                ' Find data point with label "Product F".
                Dim point As DataPoint
                For Each point In e.Chart.Series(0).Points
                    position.X = position.X + 1

                    If poInteger.AxisLabel = "Product F" Then
                        position.Y = CType(poInteger.YValues(0), single)
                        Exit For
                    End If
                Next

              ' Get relative coordinates of the data point values found.
                position.X = CType(e.ChartGraphics.GetPositionFromAxis("Default", AxisName.X, position.X), single)
                position.Y = CType(e.ChartGraphics.GetPositionFromAxis("Default", AxisName.Y, position.Y), single)

                ' Convert relative coordinates to absolute coordinates.
                position = e.ChartGraphics.GetAbsolutePoint(position)

                ' You cannot directly convert 3D chart axis values to absolute values, they must first be
                ' converted into Point3D objects, and then transformed into absolute values.
                ' Draw custom object.
                Dim radius As Integer
                For  radius = 20 To  80- 1  Step radius += 10
                e.ChartGraphics.Graphics.DrawEllipse(Pens.Red,
                position.X - radius / 2,
                position.Y - radius / 2,
                radius,
                radius)
                Next
            End If
End Sub
|
| C# |
Copy Code |
using Dundas.Charting.WebControl;
   ...

private void chart1_PrePaint(object sender, ChartPaintEventArgs e)
{
        if (sender is ChartImage)
         {
             PointF position = PointF.Empty;
             // Find data point with label "Product F".
             foreach (DataPoint point in e.Chart.Series[0].Points)
             {
                 ++position.X;

                 if (point.AxisLabel == "Product F")
                 {
                     position.Y = (float)point.YValues[0];
                     break;
                 }
             }
             // Get relative coordinates of the data point values found.
             position.X = (float)e.ChartGraphics.GetPositionFromAxis("Default", AxisName.X, position.X);
             position.Y = (float)e.ChartGraphics.GetPositionFromAxis("Default", AxisName.Y, position.Y);

             // Convert relative coordinates to absolute coordinates.
             position = e.ChartGraphics.GetAbsolutePoint(position);

             // You cannot directly convert 3D chart axis values to absolute values, they must first be
             // converted into Point3D objects, and then transformed into absolute values.
             // Draw custom object.
             for (int radius = 20; radius < 80; radius += 10)
             {
             e.ChartGraphics.Graphics.DrawEllipse(Pens.Red,
             position.X - radius / 2,
             position.Y - radius / 2,
             radius,
             radius);
             }
        }
}
|


