


Overview
This topic will give you a head start on creating great looking charts for all of your ASP.NET applications. The main focus of this topic is the Dundas Chart & Data Wizard™. Using this wizard will allow you to create charts with a minimum of code required.
Creating a Chart Using the Wizard
To easily create a new chart for your web application, do the following:
- Create a new Web Application Project using either C# or VB.NET ("File | New | Project").
- Add a chart to your Web Form by either double-clicking on the Chart toolbox icon (installed in the Dundas tab of the toolbox), or by clicking on the icon once then "drawing" the chart onto the form using the left mouse button.
- The Dundas Chart & Data Wizard™ comes up allowing you to design the appearance of your chart, and data-bind to your datasource.
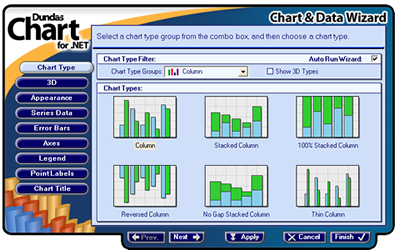
Figure 1: The Dundas Chart & Data Wizard™.
- When finished designing your chart, press the Finish button.
The wizard can be re-launched, at any time, either by right-clicking on the chart and choosing Wizard from the context menu, or by using the wizard link at the bottom of the Property browser.
For more information on how to create a chart using the wizard, see the topic on Using the Chart and Data Wizard™.
 Note Note |
|---|
| The chart type can be changed at design time by changing the Type property located in the Series Collection Editor dialog, which is displayed when you click on the Series property in the Properties window. |
Adding Data to The Chart
If you have not used the wizard to data-bind your chart to a datasource, then we will proceed to add four data points to the chart. We are doing this at design time using the Properties window, where each data point corresponds to a column. These data points will then be added to the default data series provided.
To add the four data points as described above, do the following:
- Click on the Series (Collection) property in the Properties window, this will display the Series Collection
Editor shown in Figure 2 below.
Here you can see that we have two data series, namely Series1 and Series2. Choose Series1 and go to the Default Properties section of the editor under the Data category.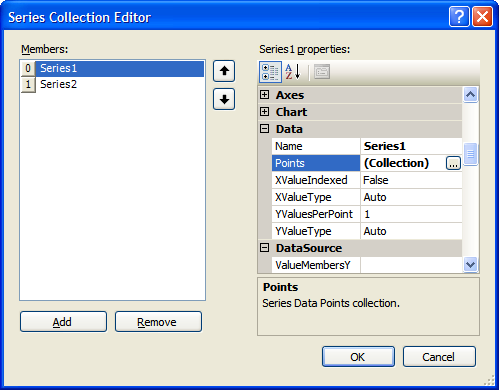
Figure 2: The Series Collection Editor showing one data series by default.
- In the Data category you will find the Points (Collection) property, click on this property to display the DataPoint Collection Editor shown in Figure 3 below.
- Add four data points by using the Add button, then after adding each data point, set the YValues property to an arbitrary value. This
value determines the size of the corresponding column. Note that the XValue property for each data point can be left to zero (0), since we can we have
the option to display data along the x-axis automatically.
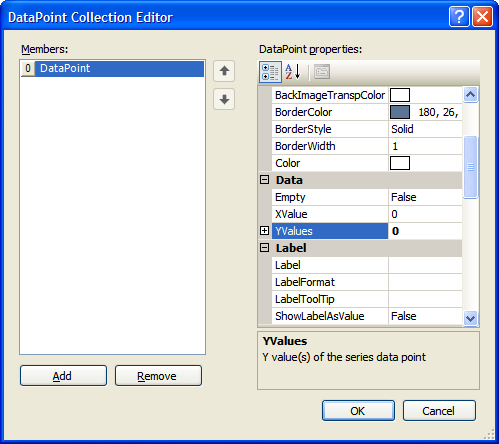
Figure 3: The DataPoint Collection Editor.