Overview
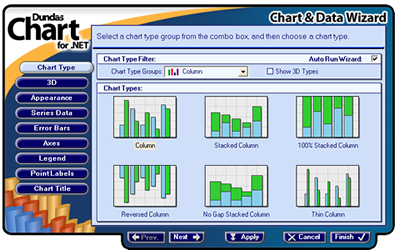
Dundas Chart for ASP.NET comes with the Dundas Chart & Data Wizard™ shown in Figure 1 below. This wizard allows you to create many kinds of charts in a quick and easy manner, with a minimum of coding required. In addition to creating beautiful charts, the Dundas Chart & Data Wizard™ acts as an educational tool, and can be used at design-time to create your charts, or at run-time by your end-users. This article discusses how to work with the Dundas Chart & Data Wizard™.

Figure 1: The Dundas Chart & Data Wizard™.
Displaying the Wizard at Design-Time
The Chart & Data Wizard™ is displayed at design-time when:
- The Chart control is dropped onto a form, and the Auto Run Wizard box is checked.
- The you click on the Wizard link at the bottom of the Properties window.
- You choose Wizard option from the chart's context menu.
Displaying the Wizard at Run-Time
To display the wizard at run-time:
- Add a reference to the DundasChartWizard.dll.
- Create an instance of the DundasChartWizardForm.
- Initialize the chart control reference, and optionally load data from the chart into the wizard using the SetChartControl method. If the second parameter is set to false, then the existing chart data will not be used, instead the wizard will use default chart values.
- Show the wizard form.
Example
This example demonstrates how to display the wizard for the end-user to manipulate, and load the existing Chart data into the wizard.
| Visual Basic |  Copy Code Copy Code |
|---|---|
|
|
| C# |  Copy Code Copy Code |
|---|---|
|
|
How to Use the Wizard
The selections that you make in the wizard, while in the Visual Studio's designer, can by applied to the charting control by clicking on the Apply button. The Cancel button is used to cancel any selections made in the wizard, and the Finish button is used to apply all selections made within the wizard, then exit the wizard.
The wizard has a number of tabbed pages that you can use as you design your chart. The content on these pages will vary slightly according to the type of chart being designed and created.
The following is a listing of the pages used by the wizard to design a chart:
- Chart Type - This page is used to select a chart type and style.
- 3D - This page is used to display the chart in 3D, and set 3D related properties.
- Legend - This page is used to toggle the legend display on or off, and set legend related properties.
-
Appearance - This page has three tabbed folders.
- Appearance Styles - This tab is used to set all appearance related properties.
- Border Styles - This tab is used to set all border style properties.
- The Third Tab - The third tab lets you select a chart element using your mouse, and then set its properties accordingly.
- Series Data - This page is used to create database connections, and to apply individual data columns to a Series value.
- Error Bars - This page allows you to create error bars.
- Axes - This page is used to set various axis related properties, such as the type of values displayed, numerical versus DateTime axis labels.
- Point Labels - This page is used to toggle the display of data points on or off, and set point label related properties.
- Chart Title - This page is used to set the text of the chart's title, as well as its font properties.
Points to Note While Working With the Wizard
- When the wizard is run for the first time, it will use the default values for all of the chart control's properties.
- One data series is normally added for pie and doughnut charts, however, two data series will be added for all other chart types. These data series will not contain data points since the adding of data is left up to you.
- When running the wizard after a Chart instance is created (i.e. a Chart instance has focus) the wizard will be populated using the data from the selected Chart control in the Designer.
- Chart area properties will always be read from the first chart area.
- Series properties will be read from the first data series (the exception to this is the appearance properties of the series, such as background and color, which can be set in the Advanced tab folder of the Appearance page).
- When the wizard saves any changes, all chart area properties will be applied to all chart areas, and all series related properties that do not deal with chart appearance will be applied to all series. For example, if Point Labels are specified using the wizard then all chart series will use data point labels.
Getting Started
Quick Start
Chart Coordinate System


