


Overview
This article discusses the process of creating a chart for your ASP.NET applications.
Before proceeding any further, we recommend that you read the topic on Chart Elements. This topic will provide you with a basic understanding of the elements that constitute a chart image.
We recommend that you read the topic on Programming Techniques. This topic will give you tips and techniques which are useful for developing web applications using Visual Studio .NET.
Creating a Chart
A chart can either be created using the Dundas Chart & Data Wizard™, or it can be manually created by adding a Chart control instance to a Web form and then setting its properties.
If you are using the wizard to create a chart then please note the following points:
- the wizard allows for the selection of chart types, as well as chart styles. Basic formatting of the chart can also be performed, and some advanced features can be set in the Appearance page, using the Advanced tab folder.
- the wizard will add one data series for pie and doughnut charts, and will add two series for all other chart types. However, these series will not be populated with data points, it is up to the developer to assign data to the newly created series after the wizard has created the chart.
If you do not use the wizard please perform the following steps to generate a chart image:
- Create an instance of the Chart control. For ease of use we recommend adding a chart instance from the toolbox at design-time.
For more details, see the topic on Creating a Chart Instance.
- Add at least one ChartArea object to the chart (note that when a Dundas Web Chart is added to an .aspx page a default ChartArea object named "Default" is automatically provided). To add a ChartArea object at design-time click on the ChartAreas collection property in the Properties Window, and then click the "Add" button. To add a chart area at run-time use the Add or Insert method of the ChartAreas collection property.
- Add at least one Series object, which represents a data series (note that when a Dundas Web Chart is added to an .aspx page a default Series object named "Default" is automatically provided). To add a series at design-time click on the Series property in the Properties Window, and then click the "Add" button. To add a series at run-time use the Add or Insert method of the Series collection property.
Some chart types can only display one series (e.g. pie charts) while others can, or must, display multiple series (e.g. stacked bar charts). Please refer to the "Chart Types" topics for details concerning a particular chart type and data requirements. - All Series objects to be plotted must be associated with a ChartArea object, which is used to plot a series' data points. A series is automatically assigned to the "Default" ChartArea object, or the first available chart area if "Default" does not exist once it has been added to the control. To assign a Series to a chart area other than the default at design-time click on the Series property in the Properties Window, and then select the desired ChartArea from the "ChartArea" listbox. To do this at run-time set ChartArea property of the Series object.
- The chart type to be displayed must be set (note that the default chart type is the column chart). To do this at design-time click on the "Series" property in the Properties Window, and then select the desired chart type from the "Chart Type" listbox. To do this at run-time set the ChartType property of the Series object.
- Data points need to be added to the data series being plotted. Each data series, represented by a Series object, should store multiple, related data points. To add data at design-time open the "Series Collection Editor" dialog by clicking on the "Series" property in the Property Window, and then open the "Data Point Collection Editor" by clicking on the Points property. Click the "Add" point to add the data point, and set the value of the data point using the YValues property. Repeat this until all data has been added. Note: most chart types only require data points that have one value (set by the YValues property), however, there are several chart types that require more than one data point value (e.g. bubble, candlestick and stock charts). For more information see the Chart Types and Data Requirements for Chart Types topics.
You can also add data at run-time using the AddY, AddXY, InsertY and InsertXY methods of the Points property. Data can also be bound at run-time by binding to a datasource.
Example
This example demonstrates how to create the bar chart displayed below. We will assume that an instance of the chart, called Chart1, has been created at design-time. We also assume that Chart1 has a chart area named Default.
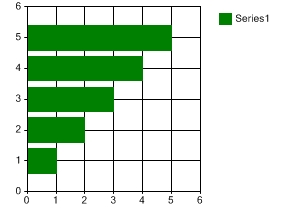
Figure 1: The Bar chart.
| Visual Basic |  Copy Code Copy Code |
|---|---|
| |
| C# | Copy Code |
|---|---|
| |