


Overview
A Keyword is a specially formatted character sequence that gets replaced by an associated Chart Series value, or calculated value. Simply put, Keywords are words that can be used to replace some type of data within a chart element. Using Keywords gives you the added flexibility to assign custom values to labels for chart series, data points, and legend items.
Design-Time Keywords Editor
To simplify the process of using keywords, all properties that use keywords can be formatted at design-time using the String Keywords Editor shown in Figure 1 below. This editor is accessible through the Property window.
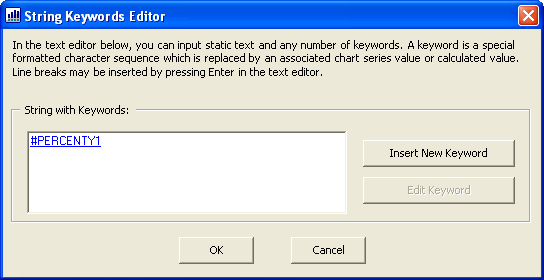
Figure 1: The String Keyword Editor can be used to create or edit your keywords.
To insert a new keyword, click the Insert New Keyword button to bring up the Keyword Editor. To edit an existing keyword that is shown in the String Keyword Editor, select the keyword, and click the Edit Keyword button.
Formatting Strings
The Keyword Editor is where you specify your formatting particulars. For example, when you set the Format option to Percent for the first Y value, the resulting keyword produced is "#VALY{P}". You can also apply format strings in code-behind using the same nomenclature, you do this by following the keyword with a format specifier enclosed in braces. For information concerning the types of formatting that can be used, see the Standard Numeric Format Strings topic in the MSDN library.
Using Keywords
The following table provides a list of supported keywords.
|
Keyword |
Replaced By |
Applicable To |
Supports Multiple Y Values |
|---|---|---|---|
|
#VALX |
X value of the data point. |
Data points only. |
|
|
#VAL, #VALY, |
Y values of the data point. |
Data points only. |
|
|
#SERIESNAME |
Series name. |
Data points and series. | - |
|
#LABEL |
Data point label. |
Data points only. | - |
|
#AXISLABEL |
Axis data point label. | Data points only. | - |
|
#INDEX |
Data point index. |
Data points only. | - |
|
#PERCENT |
Percentage of the data point Y value. |
Data points only. |
|
|
#TOTAL |
Total of all Y values in the series. |
Series only. |
|
|
#LEGENDTEXT |
Legend text. |
Legend only. | - |
|
#AVG |
Average of all Y values in the series. | Series only. |
|
|
#MIN |
Minimum data point of all Y values in the series. | Series only. |
|
|
#MAX |
Maximum data point of all Y values in the series. | Series only. |
|
|
#FIRST |
First data point of all Y values in the series. | Series only. |
|
|
#LAST |
Last data point of all Y values in the series. | Series only. |
|

For chart types that support multiple Y values, you can specify the index of the Y value that the keyword applies to. For example, when a bubble chart is used, the keyword #TOTALY2 specifies the total of all Y2 values in the series.
Example
This example demonstrates how to use keywords to set series point labels.
| Visual Basic |  Copy Code Copy Code |
|---|---|
|
|
| C# | Copy Code |
|---|---|
|
|