Overview
Axis label styles consist of font properties such as face, color, angle, style (italics, bold, etc.), and these label styles are all exposed through an Axis object's LabelStyle property. All of these label styles are applied to an axis' labels, regardless of how labels are generated.
Label Format Editor
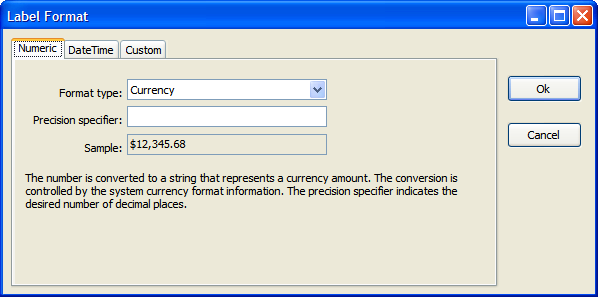
You can change the format of a label by using format strings, which are set using the Format property. For example, the label text 1000 can be changed to $1,000.00 using the currency format string C. The Label Format Editor, shown in Figure 1 below, has been provided to simplify both Numeric and DateTime formatting at design time.
To activate the Label Format Editor:
- Open the ChartArea Collection Editor.
- Select the relevant ChartArea.
- Open the Axis Collection Editor and select the required Axis.
- Expand the LabelStyle property of the axis, and click on the Format property button.
Within the Sample textbox of the editor, you can immediately preview any format type that you select from the dropdown list. In addition to the standard formats provided on either the Numeric or DateTime tabs, You can also create custom formats for both Numerical and DateTime strings.

Figure 1: The label format editor allows you choose, or create a format type.
Formatting, using the Axis.LabelStyle.Format property, does not apply to custom labels.
 Caution Caution |
|---|
| When you are using DateTime label formatting, be sure to set the XValueType, and YValueType properties of the series to DateTime. Failure to do so will prevent the formatted labels from displaying at design-time, and may also cause an error message to appear. |
If a format that consists of a date without a time is used, and DateTime values are applied to an axis that contains time values, then those time values will affect the positions of all data points even though those time values are not displayed.
Example
This example demonstrates how to format the x-axis labels to show numeric values as currencies.
| Visual Basic |  Copy Code Copy Code |
|---|---|
| |
| C# |  Copy Code Copy Code |
|---|---|
| |
Customizing Default Labels
Labels are automatically generated for all axes using the data point values or the axis scale. When default labeling is not exactly what is desired, label properties can be set or custom labels can be added using the CustomLabelsCollection object.
Removing End Labels
By default, labels are shown at the end of the axis, but these can easily be removed by setting ShowEndLabels of the Axis.LabelStyle property to False.
How To
Using Keywords


