Overview
You can display multiple data series within a common chart area. This allows you to create immediate visual comparison when viewing complementary data sets. This topic discusses techniques for creating charts that use multiple data series, within a common chart area container.
There are two ways to display multiple charts:
-
Plot multiple Series objects in the same ChartArea object.
-
Display multiple ChartArea objects in the chart image.
Multiple Series Per Chart Area
If you want to display more than one chart in a common chart area, then you must plot more than one data series. Some chart types are not compatible with others, and cannot be shown within a common chart area. For example, a bar chart and column chart are not compatible since they require the use of very different axes. Only compatible chart types may be displayed with the same chart area.
For more information on the various chart types available, see the topic on Chart Types.
Example
This example demonstrates how to add two column chart series, each with five data points, into one chart area. We will assume that an instance of a chart called "Chart1" has been created at design-time, and that it contains a chart area named "Default". Further, we assume that the WarmTones template has been applied to the original chart for appearance purposes.
 Note Note |
| When a chart instance is created at design-time, one default series and one chart area are automatically created for you. |
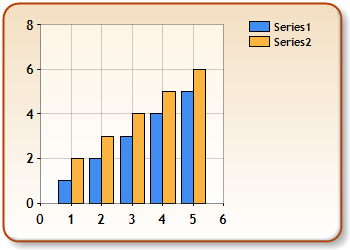
Figure 1: Multiple series in one chart area.
| Visual Basic |
 Copy Code Copy Code |
Imports Dundas.Charting.WebControl
  ...

Private Sub Page_Load(ByVal sender As System.Object, ByVal e As System.EventArgs) Handles MyBase.Load

  ' Counter variable.
  Dim i As Integer

  ' Add two series.
  Chart1.Series.Add("Series1")
  Chart1.Series.Add("Series2")

  ' Set the chart types of the 2 series to be a column chart.
  Chart1.Series("Series1").Type = SeriesChartType.Column
  Chart1.Series("Series2").Type = SeriesChartType.Column

  ' Add data to Series1 and Series2. Note that we are only setting the Y values,
  ' so X values will automatically be 0, and data will be plotted using the index
  ' of data points in the data point collection, an not by their X values.
  For i = 0 To 4
    Chart1.Series("Series1").Points.AddY(i + 1)
    Chart1.Series("Series2").Points.AddY(i + 2)
  Next
End Sub
|
| C# |
Copy Code |
using Dundas.Charting.WebControl;
  ...

private void Page_Load(object sender, System.EventArgs e)
{
    // Counter variable.
    int i;

    // Add two series.
    Chart1.Series.Add("Series1");
    Chart1.Series.Add("Series2");

    // Set the chart types of the 2 series to be a column chart.
    Chart1.Series["Series1"].Type = SeriesChartType.Column;
    Chart1.Series["Series2"].Type = SeriesChartType.Column;

    // Add data to Series1 and Series2. Note that we are only setting the Y values,
    // so X values will automatically be 0, and data will be plotted using the index
    // of data points in the data point collection, an not by their X values.
    for(i=0; i<5; i++)
    {
      Chart1.Series["Series1"].Points.AddY(i + 1);
      Chart1.Series["Series2"].Points.AddY(i + 2);
    }
}
|
Multiple Chart Areas
A chart image can display an unlimited number of chart areas, as long as each ChartArea object has a unique name. To attach a series to a ChartArea object set the Series.ChartArea property to the name of the desired chart area. By default, all series are drawn on the chart area named "Default".
Example
This example demonstrates how to display a column in the default chart area, and a bar chart in the second chart area. We assume that an instance of the chart called "Chart1" has been created at design-time, and that it contains a chart area named "Default". Further, we assume that the WarmTones template has been applied to the original chart for appearance purposes.
| Note |
| When a chart instance is created at design-time one default series, and one chart area are automatically created for you. |
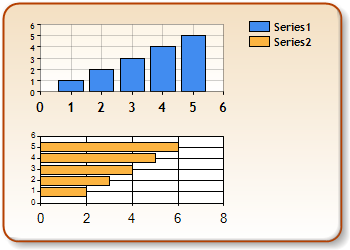
Figure 2: Multiple series in two chart areas.
| Visual Basic |
Copy Code |
Imports Dundas.Charting.WebControl
  ...

Private Sub Page_Load(ByVal sender As System.Object, ByVal e As System.EventArgs) Handles MyBase.Load
    Dim i As Integer

    ' Add another chart area to be used for the bar chart.
    Chart1.ChartAreas.Add("ChartArea2")

    ' Add two series.
    Chart1.Series.Add("Series1")
    Chart1.Series.Add("Series2")

    ' Set the chart type of the 2 series.
    Chart1.Series("Series1").Type = SeriesChartType.Column
    Chart1.Series("Series2").Type = SeriesChartType.Bar

    ' Set Series2 to be displayed in the second chart area.
    Chart1.Series("Series2").ChartArea = "ChartArea2"

    ' Add data to Series1 and Series2. We are only setting the Y values, so X values will automatically
    ' be 0, and data will be plotted using the index of data points in the data point collection.
    For i = 0 To 4
      Chart1.Series("Series1").Points.AddY(i + 1)
      Chart1.Series("Series2").Points.AddY(i + 2)
    Next
End Sub
|
| C# |
Copy Code |
using Dundas.Charting.WebControl;
  ...

private void Page_Load(object sender, System.EventArgs e)
{
    int i;

    // Add another chart area to be used for the bar chart.
    Chart1.ChartAreas.Add("ChartArea2");

    // Add two series.
    Chart1.Series.Add("Series1");
    Chart1.Series.Add("Series2");

    // Set the chart type of the 2 series.
    Chart1.Series["Series1"].Type = SeriesChartType.Column;
    Chart1.Series["Series2"].Type = SeriesChartType.Bar;

    // Set Series2 to be displayed in the second chart area.
    Chart1.Series["Series2"].ChartArea = "ChartArea2";

    // Add data to Series1 and Series2. We are only setting the Y values, so X values will automatically
    // be 0, and data will be plotted using the index of data points in the data point collection.
    for(i=0; i<5; i++)
    {
        Chart1.Series["Series1"].Points.AddY(i + 1);
        Chart1.Series["Series2"].Points.AddY(i + 2);
    }
}
|
 See Also


