


Overview
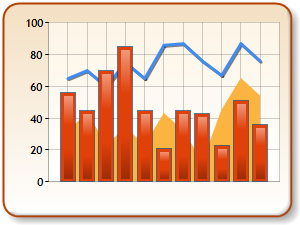
Every chart area can display more than one series within it, and each plotted series does not have to be the same chart type as can be seen in Figure 1 below.
For more information on chart types that can be combined, see the topic on Chart Types.
Figure 1: Multiple Series of different chart types used within a common chart area.
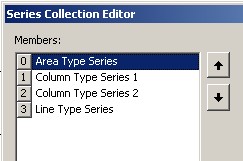
If a chart area has more than one series of different chart types within it, then they will be drawn one on top of the other. Their respective z-order shall be determined by the index position of the Series in the SeriesCollection. The first series in the collection is drawn first, the second series is drawn second on top of it, with successive series being drawn on top of those from there. The order of Series objects in this collection can be seen, and altered, at design-time by using the Series Collection Editor as shown in Figure 2 below. To graduate or demote the position (and z-order) of a series, just choose the series in the editor, and use the up and down arrow buttons to change its order the collection.
Figure 2: Series Collection Editor and relative z-order.
All series of the same chart type are drawn together, and the z-order of a particular chart type depends on the first occurrence in the SeriesCollection of that particular type. For example, assume there are four series in one chart area, like those in Figure 3 below, here we have three groups of series and three chart types: Area, Column, and Line.
Figure 3: Three different series representing three different chart types.
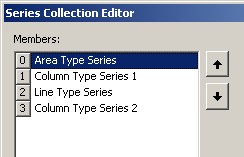
The first series in the collection is an Area chart, so the Area chart will be plotted first. The second position belongs to a Column chart, so both Column charts will be drawn next. Finally, the Line chart will be drawn.
The mode by which multiple series of the same chart type are drawn depends on the chart type.
These modes include:
-
Stacked: One on top of the other. Applies to Stacked Bar, Stacked Column, and Stacked Area chart types.
-
Clustered: Plotted side-by-side. Applies to Bar, and Column chart types.
-
Alone: Pie, and Doughnut chart types.
 Note
NotePie, and Doughnut charts allow only one series to be plotted per chart area. -
Overlapped: First occurrence is plotted beneath the next occurrence. Applies to all other chart types.