


Overview
When you bind your chart control to a datasource, it automatically detects the data type present, and performs all necessary conversions for you. This is especially important when you are working with DateTime data types. This article discusses how to work with dates, and the DateTime data type.
For more information on data-binding, see the topic on Data Binding Techniques.
Working with DateTime Data Types
To enable DateTime support, a Series object's XValueType property, or YValueType property, or both must be changed from Auto to DateTime. This allows dates to be entered at design-time using a string format like "11/12/2001" (in the short date format defined by the regional settings).
Setting these properties also allows you to preview the date labels for formatting. If no data points are provided at design-time "dummy" data points will be generated using the current date as the starting point.
DateTime formatting for axis labels is done using the Axis.LabelStyle property. DateTime formatting for data point labels is done using the LabelFormat property of Series, and DataPoint objects. There is also design-time support for DateTime formatting using the Label Format dialog.
Once the Series object's XValueType or YValueType property is set, an axis can have its Minimum and Maximum properties set to DateTime values.
 Note Note |
|---|
| All DateTime values will be persisted as doubles within the .aspx file. |
At run-time values can be converted from doubles to dates using the FromOADate and ToOADate functions of the DateTime class.
When data points, who have only their YValues set and no XValues specified, are added to a chart using an x-axis LabelStyle.IntervalType property setting of DateTime, the date for labels will be interpreted as a Double with a value of zero. This equates to a date of "12/30/1899 12:00 AM". To avoid this situation, either set a DateTime X value for the data points, or refrain from specifying the XValueType of the plotted series as DateTime.
There may be instances when axis labels, grid lines, or tick marks will not align with the data that you are presenting in the chart. For example, when the first data point is the 15th of January, yet the chart displays the first axis label, grid line, and tick marks as January 1. To align these chart objects (Axis Labels, Grid Lines, Tick Marks, and Strip Lines) use the IntervalOffset and IntervalOffsetType properties. This will allow you to offset the starting points of all these objects. The value of the offset is determined by the IntervalOffsetType (Minutes, Hours, Days, Weeks, etc.), and can be set to the same value as the IntervalType property.
Example
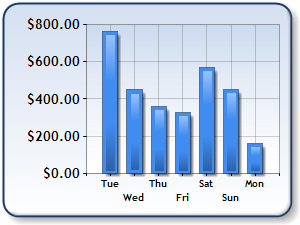
This example demonstrates how to use days for labels along the primary x-axis, and also how to display a currency along the y-axis. The XValues of points are set to DateTime values, thereby allowing for a DateTime format to be specified for the x-axis labels. We assume that a chart area called "Default" exists, and that an instance of the control is created at design-time. Further, we assume that the DundasBlue template has been applied to the original chart for appearance purposes.
Figure 1: Chart using Dates on the X-Axis.
| Visual Basic |  Copy Code Copy Code |
|---|---|
| |
| C# | Copy Code |
|---|---|
| |
Date and Time Formatting
Both standard and custom DateTime formats can be used for labels. It is worthy to note that both types of formats are influenced by the Regional Options settings in Windows control panel.
| Note |
|---|
| If a format that consists of a date without a time is used for labels, and DateTime values are applied to an axis that has time data, then the time data will affect the positions of data points even though they are not displayed. This is due to the label formatting. |
Standard Formats
Standard DateTime formats are set using specifiers which represents a formatted date or time. The following is a listing of the more common formats along with a brief description and an example of their effect on a date or time:
|
Format Specifier |
Description |
Example |
|---|---|---|
|
d |
Short date pattern. |
6/13/2003 |
|
D |
Long date pattern. |
Thursday, June 13, 2003 |
|
t |
Short time pattern. |
12:00 AM |
|
T |
Long time pattern. |
12:00:00 AM |
|
f |
A full date/time pattern that uses a short time. |
Thursday, June 13, 2003 12:00 AM |
|
F |
A full date/time pattern that uses a long time. |
Thursday, June 13, 2003 12:00:00 AM |
|
g |
A general date/time pattern that uses a short time. |
6/13/2003 12:00 AM |
|
G |
A general date/time pattern that uses a long time. |
6/13/2003 12:00:00 AM |
For a complete listing of all standard specifiers, along with their meanings, see the topic on Date and Time Format Strings in your Visual Studio documentation.
Example
This example demonstrates how to set the primary X axis labels of a series to display a short date.
| Visual Basic | Copy Code |
|---|---|
| |
| C# | Copy Code |
|---|---|
| |
Custom Formats
Custom DateTime formats are also set using specifiers, and should be set using at least two characters. The following is a listing of the more common custom formats, along with a brief description:
|
Format Specifier |
Description |
Example |
|---|---|---|
|
dd |
Displays the current day of the month as a number. |
07 |
|
ddd |
Displays the current day of the month as an abbreviated word. |
Thu |
|
dddd |
Displays the current day of the month as the full word. |
Thursday |
|
MM |
Displays the current month as a number. |
06 |
|
MMM |
Displays the current month as an abbreviated word. |
Jun |
|
MMMM |
Displays the current month as a full word. |
June |
|
yy |
Displays the year as an abbreviation. |
02 |
|
yyyy |
Displays the full year. |
2003 |
For a complete listing of all custom specifiers, and their meanings, see the topic in your Visual Studio documentation.
Example
In this example we will demonstrate how to set the primary X axis labels of a series to display the days of the week as full words.
| Visual Basic | Copy Code |
|---|---|
| |
| C# | Copy Code |
|---|---|
| |
 See Also
How To
Data-Binding Techniques
Axis Types
Chart Types
Column Chart