


Overview
A column chart uses a sequence of columns to compare values across categories.
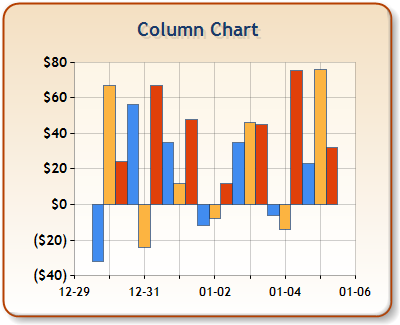
Figure 1: A Column chart.
|
Chart Details |
|
|---|---|
|
Number of Y values per point: |
1 |
|
Number of series: |
One or more |
|
Support markers: |
Yes |
|
Cannot be combined with: |
Doughnut, Pie, Bar, Stacked Bar charts, Polar, Radar, Pyramid, or Funnel |
|
Custom Attributes |
|---|
|
PointWidth, EmptyPointValue, DrawingStyle (3D only), DrawSideBySide, PixelPointWidth (3D charts only), MinPixelPointWidth, MaxPixelPointWidth, PixelPointDepth (3D charts only), PixelPointGapDepth (3D charts only), ColumnLabelStyle (2D only) |
 See Also
Chart Types
Chart Types Overview
Bar Chart