


Overview
A bar chart illustrates comparisons among individual items. Categories are organized horizontally while values are displayed vertically in order to place more emphasis on comparing values and less emphasis on time.
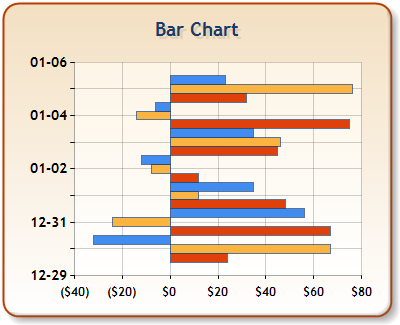
Figure 1: A Bar chart.
|
Chart Details |
|
|---|---|
|
Number of Y values per point: |
1 |
|
Number of series: |
One or more |
|
Support markers: |
Yes |
|
Cannot be combined with: |
Any chart type except Bar and Stacked Bar charts |
|
Custom Attributes |
|---|
|
PointWidth, BarLabelStyle, EmptyPointValue, DrawingStyle (3D only), DrawSideBySide, PixelPointWidth (3D charts only), MinPixelPointWidth, MaxPixelPointWidth, PixelPointDepth (3D charts only), PixelPointGapDepth (3D charts only) |
 See Also
Chart Types
Chart Types Overview
Column Chart