


| Visual Basic |  Copy Code Copy Code |
|---|---|
|
|
| C# | Copy Code |
|---|---|
|
|
Remarks
This property determines if data points that have the same X value are drawn side by side at the X value, or are drawn using the same X value. If this attribute is set to Auto, then the chart type will automatically determine if this is true or false.
 Note Note |
|---|
| Setting this attribute to true only has an effect if two or more series in a chart area have their DrawSideBySide attribute set to true. If this attribute has been set for one series, it will affect all other series being rendered. |
| Custom Attribute Summary | |
|---|---|
| Possible Values: | Auto - DataPoints are positioned according to the default method for each chart type. True - DataPoints are positioned side by side at the point without overlap. False - DataPoints are positioned at the point with a possibility of overlap, thus obscuring any point drawn underneath it. |
| Default Value: | Auto |
| 2D / 3D Limitations: | No |
| Applies to Chart Element: | Series Objects |
| Applies to Chart Types: | Bar, Column, RangeColumn, BoxPlot, Gantt, ErrorBar |
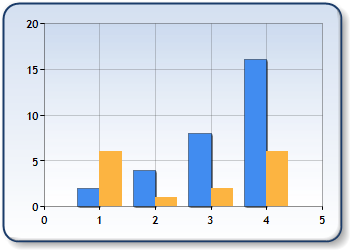
Figure 1: DrawSideBySide set to true.
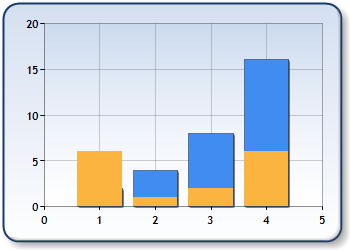
Figure 2: DrawSideBySide set to false.
 See Also
Custom Attributes
Custom Attributes Overview
Chart Types
Bar Chart
Column Chart
Range Column Chart
Box Plot Chart
Gantt Chart
Error Bar Chart