


Overview
Empty data points are points that do not have Y values. These data points are useful for controlling the appearance and structure of your chart's data, as well as handling points whose data is a null value.
Empty points can be used for:
- Representing points with NULL values.
- Changing the appearance of missing data points.
- Aligning two or more series. For information on how to align series using empty points see the Aligning Data topic.
An Example Using Empty Points
The following chart displays a daily sales report for one week. From the chart shown in Figure 1 below, no sales are recorded or shown for Wednesday. Is this because the amount of sales on Wednesday was zero, or was because of a holiday business closure for this day? If there were no sales recorded at all, and no explanation is offered as to why this is the case, then this is missing data.
| Figure 1: Ambiguity over possible missing data on Wednesday. |
Missing data can be represented as an empty point in the same way that empty points are used to represent nulls in a database field. Here is the same chart with an empty point used for Wednesday's data. As you can see in Figure 2, the ambiguity is removed by including the empty point in the chart's legend. Now we know that Wednesday was a holiday, and as such we should expect that no sales took place on that day.
![]()
Figure 2: No data due to a holiday.
Appearance of Empty Points
You can change the visual representation of plotted empty points by using the EmptyPointStyle property of the series that the point belongs to. Different attributes may be used, and depend only on the ChartType property of the series. The EmptyPointValue custom attribute can be used to treat empty points as zeros, or as an average of the points to the left and right of them.
For more information, refer to the topic on Custom Attributes.
Example
This example demonstrates how to set different empty point attributes for a three line chart series. The first series makes use of a marker to represent the empty point, the second series treats the empty point as an average, and the third series treats the empty point as a value of zero. We assume that 3 series named "Series1", "Series2" and "Series3" were added to the control at design-time, along with 10 data points per series. We also assume that the third point was missing, and has been marked as Empty. Information on adding an empty point immediately follows this sample. Finally, we assume that the DundasBlue template has been applied to the original chart for appearance purposes.
![]()
Figure 3: Different empty point styles.
| Visual Basic |  Copy Code Copy Code |
|---|---|
| |
| C# | Copy Code |
|---|---|
| |
Adding Empty Points
Empty data points can be added to a series using any of the following techniques.
To add an empty point to a data series, you can:
- Set the Empty property of each data point that you want to have as an empty data point to True.
- Data-bind to values that are DBNull. If a point is databound to a DBNull value it will be marked as empty.

- Use the InsertEmptyPoints method of the DataManipulator class. This method allows you to insert empty points into a series using intervals.
Using the InsertEmptyPoints Method
This function uses intervals along the x-axis to check if a data point exists for each of the intervals. If no point exists, an empty point is inserted.
Here are the parameters for the InsertEmptyPoints method:
-
Interval-type parameters. The Interval, IntervalOffset, IntervalType, and IntervalOffsetType parameters are used to set intervals, which are defined in the same way as axes, tick mark and grid line intervals. See Figure 4 below for a pictorial explanation of intervals.
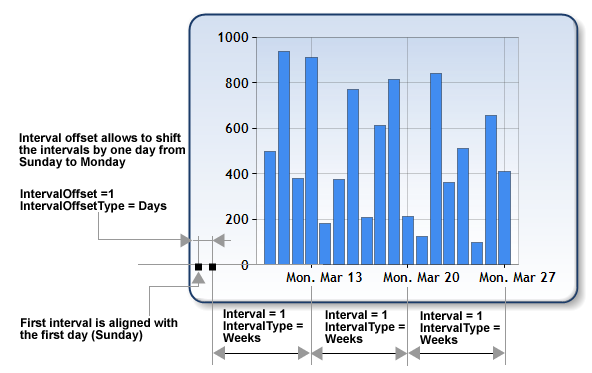
Figure 4: Intervals.
- X values range. This optional parameter defines the range of the X values, and where a check for empty points is performed. By default, minimum and maximum X values of all series are used.
- Input series. This parameter defines the input data for the insertion of empty points, and can be a Series class or a string containing a comma separated list of series names.
- Output series. This optional parameter defines the series to be used for storing the resulting data. Since Output series is optional, if it's not specified, the result of the grouping operation will be stored in the input series, thus overriding the original series' data. This optional parameter can be a Series class or a string containing a comma separated list of series names.
 Caution Caution |
|---|
| If an output series is specified by name, and a series by the same name does not exist in the chart's Series collection, then a new series will be created and added to the collection. The new series will have all of it attributes set to their default values. |
Empty points can be simultaneously inserted into multiple series by specifying the names of those series in a comma separated list.
| Caution |
|---|
| If a list of output series are specified, then the number of output series must equal the number of input series, or an exception will be thrown. |
All series of the chart Series collection may be grouped together if "*" is specified as the input series name (in which case no output series should be specified).
Example
This example demonstrates how to insert empty points into two series. In "Series1" we check each day, and insert an empty point if a day does not have data. The input series is used to store the resulting data. In the second function call, we only check for missing data every Monday by using an offset, and unlike the first method call, we store the resulting data in a series other than the input series, thereby preserving the original series' data.
| Visual Basic | Copy Code |
|---|---|
| |
| C# | Copy Code |
|---|---|
| |