


Overview

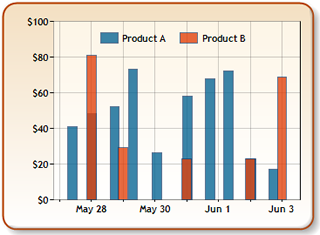
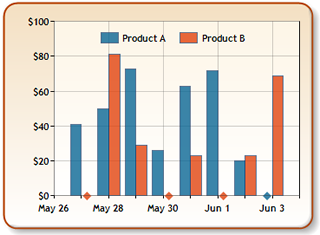
Two Series are considered to be "aligned" if they have the same number of data points, and the X values of corresponding points are equal. For example, you would consider two series to be aligned if the first points in all of their series have the same X values, and the second points in all of their series have the same X values, and so on. Figure 1 below illustrates aligned, and unaligned Series.
|
|
|
| Figure 1: Illustrates two Series, one is unaligned (shown left), the other is aligned (shown right). | |
Exceptions Alert
In the following situations, if multiple series are used and not aligned, then an exception will be thrown:
- When drawing a stacked area, bar, or column chart (including the 100% stacked charts).
- When sorting data in multiple series with one Sort method call.
- When filtering data in multiple series with one Filter method call.
- When copying, splitting, or merging data from multiple series using one CopySeriesValues method call.
- When displaying multiple series (in the same chart area) with indexed X values (XValueIndexed property set to True).
Aligning Series
If several non-aligned series store the same type of the data, and the X value range for these is similar, then they can be aligned using one of the following techniques:
- Filtering: Remove unnecessary points from the series, so that all series have the same number of points.
- Grouping: Group series points in required intervals, like days, weeks, months and so on. Multiple points are grouped into single points.

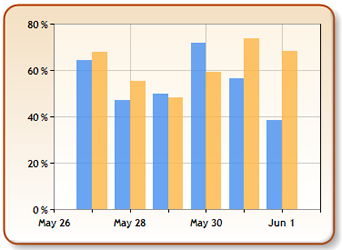
Figure 2: Series before grouping is applied (shown left), and after grouping is applied (shown right).
- Insert Empty Points: Empty points represent missing data, and can be used to maintain a consistent number of points in all series.
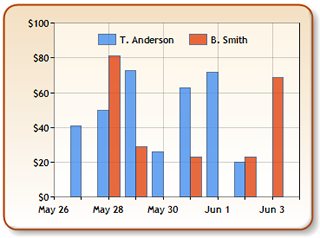
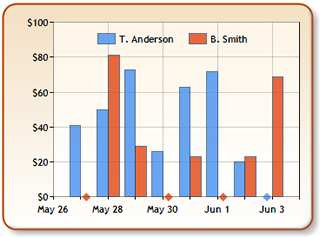
Figure 3: Series before inserting empty points (shown left), and after inserting empty points (shown right). - Combination of Above Techniques: In most cases a combination of filtering, grouping, and empty points will be required to align the series.
Common Alignment Issues and Solutions
This lists possible alignment issues and ways to solve them:
- Series that have missing points. Missing points should be represented in the series as empty points, so that all series will have the same number of data points, and the X values of the corresponding points will be equal. You can insert empty points using the InsertEmptyPoints method of the DataManipulator object (see first example below).
- Series points that are not grouped by the required interval. For example, all series have a data point for each week, except for one series that has a point for each day. In this example, the series will have the same range of X values, but the number of data points will be different. Grouping data points by weeks will align these series (see second example below). Here is another example, we have the data for each sale during a month, and we want to show the total sales amount for each working day. Some days may not have any sales, while others may have one or more. Each day with no sales should be represented in the series as empty point. Each day with more than one sale should be represented with one point (grouped), where the Y value is a total of all the sales for the day (see the third example below).
Not all series can be aligned since alignment depends on the type of data points and their values ranges. For example, let's assume two series are using their X values to store the date of a sale and their Y values for the sale amount. The first series has sales information for the year 1995 and the second series for 2001. In this case aligning these series does not make any sense due to the vastly different date of sales. Another good example would be when two series have incompatible X value types (e.g. one series uses its X values to store dates while the other one uses its X values to store the serial number of the product sold).
Example
This example demonstrates how to go about aligning Series by inserting empty points for missing data. We assume that each series must have one data point for each week.
| Visual Basic |  Copy Code Copy Code |
|---|---|
| |
| C# | Copy Code |
|---|---|
| |
Example
This example demonstrates how to align two series by grouping the data points. We will assume that each series must have one data point per week, even if the original data has a data point for each day.
| Visual Basic | Copy Code |
|---|---|
| |
| C# | Copy Code |
|---|---|
| |
Example
This example demonstrates how to align two series by grouping, adding empty points, and then filtering. We will assume that each series must have one data point for each working day, and that it is possible for the raw data to have no sales per day, or more than one sale per day.
| Visual Basic | Copy Code |
|---|---|
| |
| C# | Copy Code |
|---|---|
| |