


Overview

Grouping replaces a sequence of data points in a series with one grouped point. The X and Y values of each grouped point are calculated using a specified formula in combination with the original values of every point used.
Grouping is especially useful when there are many data points, making it difficult to spot trends in a chart. For example, the following chart displays the number of cars sold every day for about a year. If you look at the original chart data shown in Figure 1 on the left, you can appreciate that it is difficult to spot an emerge pattern or trend because of the copious number of points. Once the same data has been grouped by month, and calculated using an "average" formula, you can begin to see a definite trend, and sales pattern as shown in Figure 1 below on the right.
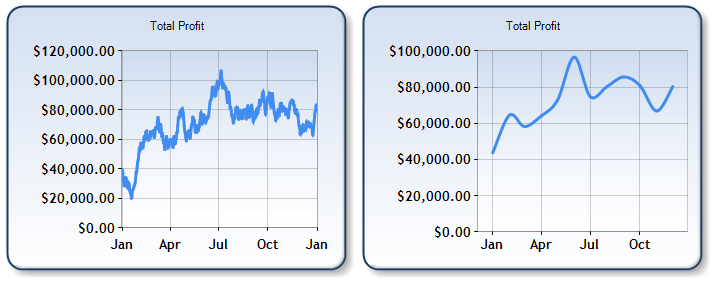 | |
| Figure 1: Total Profit charted without Grouping(shown left), and charted with Grouping (shown right). | |
Grouping Data Basics
Before grouping your data in a series, make sure that the data in the series is sorted by X value in ascending order.
For more information on sorting, refer to the topic on Sorting Data.
Grouping is accomplished using the DataManipulator object. There are two types of grouping including grouping by axis label, and grouping by interval.
The properties and methods of the DataManipulator class include:
- IgnoreEmptyPoints property. If this property is set to True (its default value), then empty points are ignored (i.e. skipped) in the calculation of a grouped point's values. If this property is set to False, they are treated as points with zero values.
- Group method. Groups data points by X value using intervals.
- GroupByAxisLabel method. Groups data points by their axis label (i.e. their AxisLabel property values).
The Group and GroupByAxisLabel methods take these parameters:
- Grouping Formula. These are the formulas that will be used in calculating the values of the grouped points.
- Interval-related parameters (used for the Group method only). There are several interval-related parameters that are used to define the grouping interval.
- Input series. Defines the input data for the grouping. Can be specified as a Series object or as a string with comma-separated series names.
- Output series. Defines the series to be used to store the resulting data. Output series is/are optional, and if not specified the result of the grouping operation will be stored in the input series, overriding the original series data. Can be specified as a Series object or as a string with comma-separated series names. If an output series is specified as a Series object, and the series has not been created and added to the SeriesCollection when the function call is made an exception will be thrown. However, if the series has not been created and added to the SeriesCollection BUT has been specified as a string expression then it will automatically be created at run-time, and have default Series properties (e.g. column chart type, etc.). In addition, the ChartArea property of this series is set to "Default", and if a chart area with the name "Default" exists in the ChartAreasCollection it will be used to draw the chart. If there is no chart area with this name the first ChartArea object in the collection will be used to display the series.
Grouping Formulas
Grouping formulas are used to calculate the X and Y values of grouped points. Refer to the table below for a list of these of formulas, and an explanation of what they do. Note that for X values, the default formula (that gets applied if one is not specified) is the "First" formula. Also it is worthy of mention that formulas for X values merely determine where the resulting data points will be plotted for the specified interval (e.g. along the left or right boundary of an interval or in the center of an interval).
|
Formula |
Description |
Used for X-Value |
|---|---|---|
|
AVE |
The average value of all data points within the given interval. |
No. |
|
MAX |
The maximum value of all data points within the given interval. |
No. |
|
MIN |
The minimum value of all data points within the given interval. |
No. |
|
SUM |
The total value of all data points within the given interval. |
No. |
|
LAST |
The last value of all data points within the given interval. |
Yes. New data points are drawn at the right-most margin of intervals. |
|
FIRST - Default - - Formula - |
The first value of all data points within the given interval. |
Yes. New data points are drawn at the left-most margin of intervals. |
|
HiLoOpCl |
Calculates the largest, smallest, opening and closing values. Opening value is the first value in the interval, while the closing value is the last value for the interval. NOTE: this formula returns four Y values, and should only be used for chart types that use four Y values (e.g. Candlestick charts). |
No. |
|
HiLo |
The largest and smallest of all data points within the given interval. NOTE: this formula returns two Y values, and should only be used for chart type that use two Y values (e.g. Bubble charts). |
No. |
|
Count |
The number of data points that have been grouped into one point. |
No. |
|
DistinctCount |
The number of data points that have been grouped into one point. Data points that have the same primary Y values are considered one point. |
No. |
|
Variance |
The variance between all data points within the given interval. |
No. |
|
Deviation |
The deviation between all data points within the given interval. |
No. |
|
Center |
The deviation between all data points within the given interval. |
Yes. New data points are drawn at the center of intervals. |
Formulas are specified using the formula string parameter of the Group and GroupByAxisLabel methods. A separate formula can be specified for some or all of a point's values. At least one formula must be provided, in which case it is used to calculate all the Y values of a point.
 Note Note |
|---|
| By default, the First formula is used to calculate the X values. |
The format of the formula parameter is:
"FORMULA[, VALUE:FORMULA, [VALUE:FORMULA[,...]]]"
Above, FORMULA is one of the formula names. VALUE is the name of the data point value this formula is applied to (e.g. "X", "Y", "Y2", "Y3", etc.).
For example, if you use the formula string "AVE, X:CENTER, Y2:MAX" for a grouping procedure, then it will result in:
- The grouped points being plotted in the center of their interval.
- The maximum Y2 value of all input points being used for all Y2 values of the grouped points.
- An average of all other Y values being calculated.
Grouping by Interval
Grouping by interval is accomplished by using the Group method. Series data points are split into intervals using their X values, and then each interval gets replaced by one point. Intervals are defined in the same way as axis labels, tick marks, and grid lines as shown in Figure 3 below.
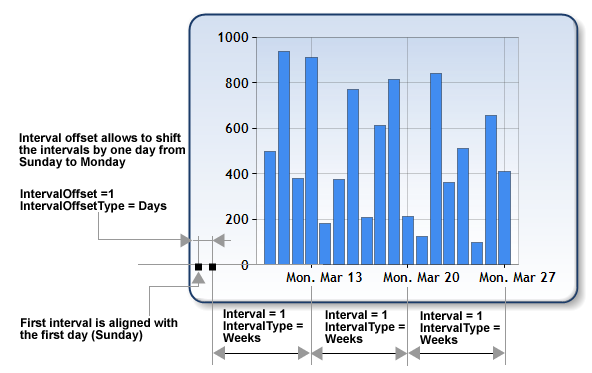 |
| Figure 3: Intervals. |
The following parameters define the interval for the Group method:
- The interval parameter which is of type double represents the interval's size.
- The intervalType parameter which is of type IntervalType, defines the units used to measure the interval.
- The intervalOffset parameter which is of type double, defines the offset from the beginning of the interval.
- The intervalOffsetType parameter which is of type IntervalType, defines the units used to measure the interval offset.
Example
This example demonstrates how to perform a Grouping operation of points by yearly quarters. The grouped points will use averaged Y values, and will be plotted at the left boundary of their intervals. These grouped points are stored in a series named "ResultSeries".
| Visual Basic |  Copy Code Copy Code |
|---|---|
| |
| C# | Copy Code |
|---|---|
| |
Grouping by Axis Label
Grouping by axis label accomplished using the GroupByAxisLabel method. All data
points with the same AxisLabel property value will be grouped together, and their Y value, values will be calculated using the specified formula, or formulas.
| Note |
|---|
| As a result of this grouping operation, data points will be sorted by their respective AxisLabel property in ascending order. |
Example
This example demonstrates how to perform a Grouping operation on points that represent the gold medals won by a number of countries. We assume that the X value of the data points are databound to a string that stores the country names, and as a result each country name will be stored using the AxisLabel property. To finish, we total the gold medal count for each grouped point and display the total number of gold medals won.
| Visual Basic | Copy Code |
|---|---|
| |
| C# | Copy Code |
|---|---|
| |
Grouping Multiple Series
The simultaneous grouping of multiple series is done using the two grouping methods of the DataManipulator class, and is accomplished by specifying a comma-separated list of the series names. This has the same effect as calling a grouping method several times using one series as a parameter.
 Caution Caution |
|---|
| If output series are specified, then the number of output series must be the same as the number of input series, otherwise an exception will be raised. |
All series in the Chart object's Series collection will be grouped if an "*" is specified as an input series name.
Example
This example demonstrates how to perform simultaneous Grouping on multiple series.
| Visual Basic | Copy Code |
|---|---|
| |
| C# | Copy Code |
|---|---|
| |