Overview

When a Series is exported, the X and Y values of all data points in the series are persisted to the in-memory cache (DataSet object), where they can easily be used for the following purposes:
- Data-binding.
- Saving into a file, or stream.
- Converting to a different format, like XML.
- Editing data.
Output Data Formats
One of the main classes of the ADO.NET architecture, the DataSet class, is used to store the exported data. First, a DataTable object is created for each series, then it is added to the Tables collection of the DataSet class. Each DataTable object has the same name as the series it represents. Each DataTable object will have two, or more, columns including one column for the X value, and one, or more, columns for the Y values. Columns of the DataTable are named after the values they are storing ("X", "Y", "Y2", "Y3", etc.).
The data type of each column depends on the data point type. Data point type of a column may be a DateTime, string, or double.
 Note Note |
| The XValueType, and YValueType properties determine the data point type. If these properties are set to Auto, then the type is automatically determined by the control. |
Each data point of the series will be stored in the DataRow object, and will be inserted into the Rows collection of the DataTable.
| Note |
|
A string value can be assigned to the X values of the points. In this case, the string is stored into the AxisLabel property, and the XAxisType property of the series is set to string. When exporting the X values of type string, the AxisLabel property must be used to access the value. |
Alternate Output Formats for Data
Using the DataSet object is the most generic and convenient way of storing structured data in memory, and you can easily convert data that is stored in a DataSet object into any format required.
Example
This example demonstrates how to convert a DataSet object into XML, and then write it to a file.
| Visual Basic |
 Copy Code Copy Code |
Imports Dundas.Charting.WebControl
  ...

' Create new series.
Dim mySeries As New Series("MySeries")

' Add series points.
mySeries.Points.AddXY(2.0F, 7.0F)
mySeries.Points.AddXY(7.0F, 15.0F)
mySeries.Points.AddXY(9.0F, 4.0F)

' Exporting series using the Series object.
Dim seriesData As DataSet = Chart1.DataManipulator.ExportSeriesValues(mySeries)

' Saving exported data as an XML file.
seriesData.WriteXml("mySeriesData.xml")
|
| C# |
Copy Code |
using Dundas.Charting.WebControl;
  ...

// Create new series.
Series mySeries = new Series("MySeries");

// Add series points.
mySeries.Points.AddXY(2.0F, 7.0F);
mySeries.Points.AddXY(7.0F, 15.0F);
mySeries.Points.AddXY(9.0F, 4.0F);

// Exporting series using the Series object.
DataSet seriesData = Chart1.DataManipulator.ExportSeriesValues(mySeries);

// Saving exported data as an XML file.
seriesData.WriteXml("mySeriesData.xml");
|
Exporting Series
The X and Y values of one or more series can be exported using the ExportSeriesValues method of the DataManipulator object. Calling this method without specifying one or more series will, by default, export all values from all series objects in the chart series collection. If you want to export the data from specific series you can specify them by name or by using a Series object.
Example
This example demonstrates how to export one, several, or all series.
| Visual Basic |
Copy Code |
Imports Dundas.Charting.WebControl
  ...

' Exporting all series in the chart series collection.
Dim allSeriesData As DataSet = Chart1.DataManipulator.ExportSeriesValues()

' Exporting two series from the chart series collection by names.
Dim twoSeriesData As DataSet = Chart1.DataManipulator.ExportSeriesValues("MySeries1, MySeries2")

' Exporting series using the Series object.
Dim mySeries As New Series("MySeries")
mySeries.Points.AddXY(2.0F, 7.0F)
mySeries.Points.AddXY(7.0F, 15.0F)
mySeries.Points.AddXY(9.0F, 4.0F)
Dim seriesData As DataSet = Chart1.DataManipulator.ExportSeriesValues(mySeries)
|
| C# |
Copy Code |
using Dundas.Charting.WebControl;
  ...

// Exporting all series in the chart series collection.
DataSet allSeriesData = Chart1.DataManipulator.ExportSeriesValues();

// Exporting two series from the chart series collection by names.
DataSet twoSeriesData = Chart1.DataManipulator.ExportSeriesValues("MySeries1, MySeries2");
Series mySeries = new Series("MySeries");

// Exporting series using the Series object.
mySeries.Points.AddXY(2.0F, 7.0F);
mySeries.Points.AddXY(7.0F, 15.0F);
mySeries.Points.AddXY(9.0F, 4.0F);
DataSet seriesData = Chart1.DataManipulator.ExportSeriesValues(mySeries);
|
Exporting Data
Data points in a series may be marked as Empty. This means that there is no real Y value assigned to the data point. While exporting the data the empty points can be either ignored or exported as DBNULL values, depending on the IgnoreEmptyPoints property of the DataManipulator object. If IgnoreEmptyPoints is set to true then empty points are not exported. If it is False the empty data points will be stored as DBNull objects in the DataRow object.
Example
This example demonstrates how to data-bind a DataGrid control to an exported series. We assume that a DataGrid object was added to the web page. Further, we assume that the DundasBlue template has been applied to the original chart for appearance purposes. The result of the data-binding operation is shown in Figure 1 below.
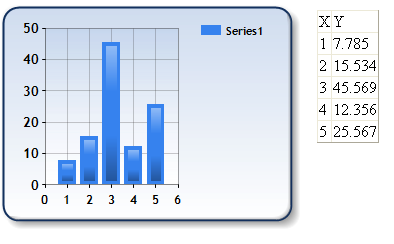
Figure 1: A databound chart.
| Visual Basic |
Copy Code |
Imports Dundas.Charting.WebControl
  ...

' add data to series.
Chart1.Series("Series1").Points.AddY(7.785)
Chart1.Series("Series1").Points.AddY(15.534)
Chart1.Series("Series1").Points.AddY(45.569)
Chart1.Series("Series1").Points.AddY(12.356)
Chart1.Series("Series1").Points.AddY(25.567)

' Export series values into DataSet object
dataset = Chart1.DataManipulator.ExportSeriesValues()

' Data bind DataGrid control.
DataGrid1.DataSource = dataset

' Set Series name for data
DataGrid1.DataMember = "Series1"

DataGrid1.DataBind()
|
| C# |
Copy Code |
using Dundas.Charting.WebControl;
  ...

// add data to series.
Chart1.Series["Series1"].Points.AddY(7.785);
Chart1.Series["Series1"].Points.AddY(15.534);
Chart1.Series["Series1"].Points.AddY(45.569);
Chart1.Series["Series1"].Points.AddY(12.356);
Chart1.Series["Series1"].Points.AddY(25.567);

// Export series values into DataSet object
dataset = Chart1.DataManipulator.ExportSeriesValues();

// Data bind DataGrid control.
DataGrid1.DataSource = dataset;

// Set Series name for data
DataGrid1.DataMember = "Series1";

DataGrid1.DataBind();
|
Example
This example demonstrates how to display an exported series' data in a table. We assume that a DataTable named "Table1" has been added to the from. Further, we assume that the DundasBlue template has been applied to the original chart for appearance purposes. The result of displaying the series data in the table is shown in Figure 2 below.
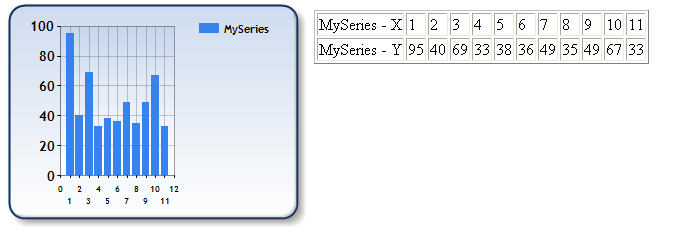
Figure 2: The result of displaying the series data in the table.
| Visual Basic |
Copy Code |
Imports Dundas.Charting.WebControl
  ...
' <summary>
' Create a data series, and add points to it. Add the series
' into the Series collection, and export using the Series
' object.
' </summary>
Protected Sub CreateSeries()
    ' Create new series and add data.
    Dim mySeries As Series = New Series("MySeries")
    Dim randomValue As Random = New Random

    ' Add points to the series.
    Dim index As Integer = 1
    Do While (index <= 11)
        mySeries.Points.AddXY(index, randomValue.Next(1, 100))
        index = (index + 1)
    Loop

    ' Add series into the collection.
    Chart1.Series.Add(mySeries)

    ' Exporting series using the Series object.
    Dim seriesData As DataSet = Chart1.DataManipulator.ExportSeriesValues(mySeries)

    ' Populate table with the series data in the data set.
    InitializeTable(Table1, seriesData, "MySeries")
End Sub
' <summary>
' Initialize table from the DataSet object.
' </summary>
' <param name="table">
' Table object to initialize.
' <param name="dataSet">
' Series data.
' <param  name="tableName">
' Series name to be used.
Protected Sub InitializeTable(ByVal table As Table, ByVal dataSet As DataSet, ByVal tableName As String)
    For Each column As DataColumn In dataSet.Tables(tableName).Columns
        ' Create new table row for each column.
        Dim row As TableRow = New TableRow

        ' Add title cell.
        Dim cell As TableCell = New TableCell
        cell.Controls.Add(New LiteralControl((dataSet.Tables(tableName).TableName + (" - " + column.ColumnName))))
        row.Cells.Add(cell)

        ' Add data cells.
        For Each dataRow As DataRow In dataSet.Tables(tableName).Rows
            Dim dataCell As TableCell = New TableCell
            dataCell.Controls.Add(New LiteralControl(dataRow(column).ToString))
            row.Cells.Add(dataCell)
        Next

        ' Add row into the table.
        table.Rows.Add(row)
    Next
End Sub
|
| C# |
Copy Code |
using Dundas.Charting.WebControl;
  ...

///
/// Create a data series, and add points to it. Add the series
/// into the Series collection, and export using the Series
/// object.
///


protected void CreateSeries()
{
    // Create new series and add data.
    Series mySeries = new Series("MySeries");
    Random randomValue = new Random();

    // Add points to the series.
    for(int index=1; index<=11; index++)
    {
        mySeries.Points.AddXY(index, randomValue.Next(1, 100));
    }

    // Add series into the collection.
    Chart1.Series.Add(mySeries);

    // Exporting series using the Series object.
    DataSet seriesdata = Chart1.DataManipulator.ExportSeriesValues(mySeries);

    // Populate table with the series data in the data set.
    InitializeTable(Table1, seriesdata, "MySeries");
}


///
/// Initialize table from the DataSet object.
///
///
/// Table object to initialize.
///
///
/// Series data.
///
///
/// Series name to be used.
///
protected void InitializeTable(Table table, DataSet dataSet, string tableName)
{
    foreach(DataColumn column in dataSet.Tables[tableName].Columns)
    {
        // Create new table row for each column.
        TableRow row = new TableRow();

        // Add title cell.
        TableCell cell = new TableCell();
        cell.Controls.Add(new LiteralControl(dataSet.Tables[tableName].TableName +  " - " + column.ColumnName));
        row.Cells.Add(cell);

        // Add data cells.
        foreach(DataRow dataRow in dataSet.Tables[tableName].Rows)
        {
            TableCell dataCell = new TableCell();
            dataCell.Controls.Add(new LiteralControl(dataRow[column].ToString()));
            row.Cells.Add(dataCell);
        }

        // Add row into the table.
        table.Rows.Add(row);
    }
}
|
Example
This example demonstrates how to export series data, filter the data, and then bind the data to a DataView object. The result of data-binding to the filtered series data is shown in the Figure 3 below. Notice that the points at position 2 and 4 were removed.
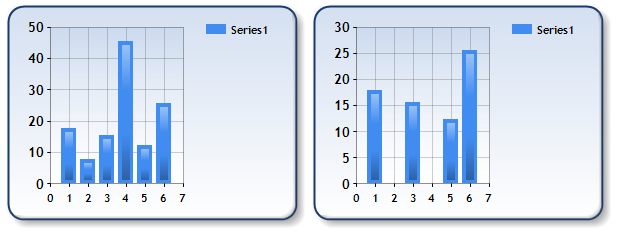
Figure 3: The result of data-binding to the filtered series data.
| Visual Basic |
Copy Code |
Imports Dundas.Charting.WebControl
  ...

    ' Create new series and add data.
    Dim Series1 As Series =  New Series("Series1")
    Series1.Points.AddXY(1, 17.785)
    Series1.Points.AddXY(2, 7.785)
    Series1.Points.AddXY(3, 15.534)
    Series1.Points.AddXY(4, 45.569)
    Series1.Points.AddXY(5, 12.356)
    Series1.Points.AddXY(6, 25.567)

    ' Exporting series using the Series object.
    Dim seriesData As DataSet =  Chart3.DataManipulator.ExportSeriesValues(Series1)

    ' Get default data view of the series data.
    Dim defaultView As DataView =  seriesData.Tables("Series1").DefaultView

    ' Filter all points with Y values less then 10 and more than 25.
    defaultView.RowFilter = "Y > 10 And Y < 30"

    ' Databind series to the filtered view.
    Series1.Points.DataBindXY(defaultView, "X", defaultView, "Y")

    ' Add series into the collection.
    Chart1.Series.Add(Series1)
|
| C# |
Copy Code |
using Dundas.Charting.WebControl
  ...

    // Create new series and add data.
    Series Series1 = new Series("Series1");
    Series1.Points.AddXY(1, 17.785);
    Series1.Points.AddXY(2, 7.785);
    Series1.Points.AddXY(3, 15.534);
    Series1.Points.AddXY(4, 45.569);
    Series1.Points.AddXY(5, 12.356);
    Series1.Points.AddXY(6, 25.567);

    // Exporting series using the Series object.
    DataSet seriesData = Chart3.DataManipulator.ExportSeriesValues(Series1);

    // Get default data view of the series data.
    DataView defaultView = seriesData.Tables["Series1"].DefaultView;

    // Filter all points with Y values less then 10 and more than 25.
    defaultView.RowFilter = "Y > 10 And Y < 30";

    // Databind series to the filtered view.
    Series1.Points.DataBindXY(defaultView, "X", defaultView, "Y");

    // Add series into the collection.
    Chart1.Series.Add(Series1);
|
 See Also


