Overview

The manner in which data is handled depends largely on the architecture of the object, or objects, storing that data. Dundas Chart for ASP.NET stores its data in a hierarchical framework that allows you to access that data as needed, in an intuitive and logical manner. This article discusses the process of copying, splitting, aligning, and merging the web control's data.
Architecture
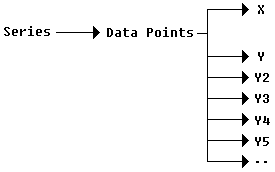
The architecture of Dundas Chart for ASP.NET stores data in the following way:
- One Series collection of data is present.
-
-
Each data Series has a collection of Data Points within it.
-
-
Each Data Point has one X value, and multiple Y values within it.
-
-
Figure 1 below, illustrates the manner in which data is split. The Series object, contains Data Points, which in turn contain the X value, and multiple Y values.
 |
| Figure 1: Splitting data points. |
Some chart types use multiple Y values (e.g. Stock, Bubble, Range chart, etc) while others only use the first Y value of data points (e.g. Line, Column, Pie chart, etc). To display dynamic charts where the chart type switches from a single Y value type to a multiple Y value type, then it must be possible to copy Y values. The CopySeriesValues method, of the DataManipulator class, does this using just one line of code.
Data Alignment
To use the CopySeriesValues method with different series, all X values for each series must have aligned data.
Multiple series are considered to be aligned if:
-
They have same number of data points.
-
Corresponding data points (e.g. points which have the same index) have the same X values.
 Caution Caution |
|---|
| If Series are not aligned, then calling CopySeriesValues will result in an exception being thrown. |
For more information on data alignment along with code samples, see the topic on Aligning Series.
Copying, Merging and Splitting Data
How the CopySeriesValues method is used determines if data is copied, split or merged. We have defined: "splitting" as copying multiple Y values from one source series to multiple destination series; "merging" as copying values from multiple source series to populate one destination series; and "copying" as all other copy operations.
 Caution Caution |
|---|
| When using the CopySeriesValues method, the number of source values must match the number of destination values, otherwise an exception will be thrown. |
Copying Data
Data is copied if data point values are moved from one series to another, and one or multiple Y values can be copied using one method call. The first source value will be copied to the first destination value, the second source value to the second destination value, and so on.
Here are two examples of copy operations:
1. This example copies the first Y values of Series1's data points to the second Y values of Series2's data points.
Chart1.DataManipulator.CopySeriesValues("Series1:Y","Series2:Y2");
Chart1.DataManipulator.CopySeriesValues("Series1:Y","Series2");
Merging Data
Data is considered to be "merged" when data point values are copied from multiple source series to one destination series. The first source value will be copied to the first destination value, the second source value to the second destination value, and so on.Example
This example demonstrates how to merge 4 series with one Y-value each into one series with 4 Y-values.

Figure 3: Four line series with one Y-value each.
| Visual Basic |  Copy Code Copy Code |
|---|---|
| |
| C# |  Copy Code Copy Code |
|---|---|
| |
Splitting Data
Data is considered to have been "split" when data point values are copied from one source series to multiple destination series. The first source value will be copied to the first destination value, the second source value to the second destination value, and so on.
Here is an example of a "splitting" operation, which copies the first and second Y values of Series1's data points, to the first Y values of all data points in Series2, and the first Y values of all data points in Series3 respectively.
Chart1.DataManipulator.CopySeriesValues("Series1:Y,Series1:Y2","Series2: Y,Series3:Y");


