


Overview

Returns the probability for the F-distribution.
Applying the Formula
All statistical formulas are calculated using the Statistics class, and the following table describes how to use its FDistribution method.
| Value/Description | Example | |
|---|---|---|
| Formula Name: | F Distribution | Statistics.FDistribution(6.31, 15, 7) |
| Parameters: |
|
Statistics.FDistribution(6.31, 15, 7) |
| Return: | A double that represents the probability for the F distribution. |
- |
Statistical Interpretation
Suppose  and
and ![]() are the observed variances for two samples, of sizes n and m, drawn from normal populations with variances
are the observed variances for two samples, of sizes n and m, drawn from normal populations with variances  and
and  , respectively. We can test the null hypothesis that
  by calculating the distribution of the variance ratio.

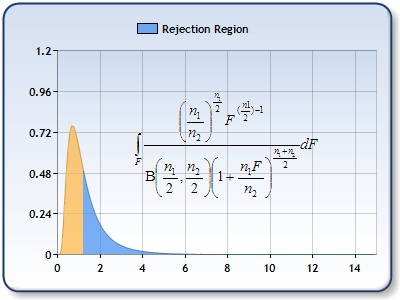
Figure 1: Graph of F Distribution.
Example
This example demonstrates how to calculate the F distribution probability.
| Visual Basic |  Copy Code Copy Code |
|---|---|
| |
| C# | Copy Code |
|---|---|
| |
 See Also
Formulas
Formulas Overview
Statistical Formulas
Using Statistical Formulas