


Overview
Selection is a process where a user clicks on a chart element, and as a result, some sort of action is taken depending on what the user clicked on. Drilldown is an extension of this selection process, and typically employs a sub-set of data to display as a result of the user having clicked on a data point or corresponding legend item. Drilldown and selection is implemented using client-side image maps, and is easily accomplished when rendering the chart as an <IMG> tag. If the chart is being rendered using binary streaming, then drilldown becomes more complex, since two pages and two chart instances are required. If this is the case, please read the topic on Binary Streaming and Image Maps before using image maps and binary streaming. Also, if you are not familiar with client-side image maps, we recommend that you read the topic on Client-Side Image Maps to help familiarize yourself with the topic.
Implementing Drilldown
To implement drilldown, follow these steps:
- Create a chart, and make sure that the MapEnabled property of the root Chart object is set to its default value of True.
- Set the destination URL(s) for the elements that the end-user will be able to click on to display another chart. Chart items that can be clicked on include: data points, series, legend items, and strip lines. Data points, series, and strip lines all have an Href property that determines their destination URLs. When setting the URLs of legend items, use the LegendHref property of series, data points, or both for the default legend items. You should use the Href property of the LegendItem objects for the custom legend items (for more information concerning default versus custom legend items see the topic on Default and Custom Legend Items). The destination URLs determine the web page(s) that will handle the selection, and display of resulting data (i.e. the data that the end-user drills down into).
- To determine what chart element the end-user selected, the specified URLs need to use a querystring. This querystring is set using the Href, and LegendHref properties. Querystrings can be hardcoded for any chart element that the end-user can click on (e.g. the Href property of the first data point in Series1 could be set to: Chart1.Series("Series1").Points(0).Href="www.MyWebSite.com/page1.aspx?1"), or they can be set using two special keywords: #SER and #INDEX. The #SER keyword is replaced by the name of the series the user clicked on, while #INDEX is replaced by the index (0-based) of the data point that was selected. For example, to pass as a querystring item the index of the data point selected by the end-user a series could have its Href property set using the following line of code: Chart1.Series("Series1").Href = "http://www.MySite.com/?#INDEX".
 Note
NoteWhen a series has its Href property set, then by default all of its data points will use this URL. However, it is possible to override the URL for a specific data point by setting the Href property for that point. -
To display a new chart, code the logic in the page(s) that handle the selection.
Some Points to Note
Please note the following points:
- You must specify the destination URLs. Each data point, series, legend item, and strip line displayed by the chart can have an associated URL. This gives you a degree of latitude to specify the web pages that will be responsible for displaying the data that the end-user can drilldown into, and the items that the end-user can click on.
- It is a common practice to use one page for displaying all charts, but whether you choose to do so is entirely up to you. To ensure that one page handles the drilldown operations, just make sure that all URLs point to the page in question.
- You can specify custom map areas by using the MapAreas property of the root Chart object. These custom areas, unlike map areas that are associated with a chart element, have user-defined shapes and coordinates, and can also be used for drilldown procedures.
- If your chart is being rendered as a binary stream instead of an image tag, then only the page with a rendering type set to RenderType.ImageMap needs to set the destination URLs.
- You can use the MapAreaAttributes, and LegendMapAreaAttributes properties to specify map area attributes such as "Target=_Blank".
Example
This example demonstrates how to display a pie chart to the end-user, where each slice represents a quarterly sales figure. When the end-user clicks on a pie slice, or a legend item that corresponds to a slice, we display a column chart that shows the monthly sales figure for 3 sales people. For simplicity, we use hard-coded random numbers as the sales figures to show. Also, the column charts are displayed using separate browser instances. We also assume that a series, named "Series1", has been added at design-time, and that the name of this web page is "WebForm1.aspx". Further, we assume that the DundasBlue template has been applied to the original chart for appearance purposes.
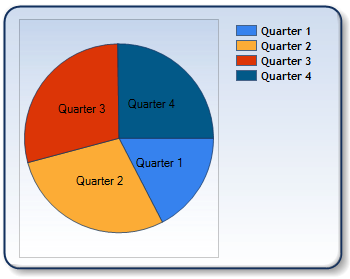 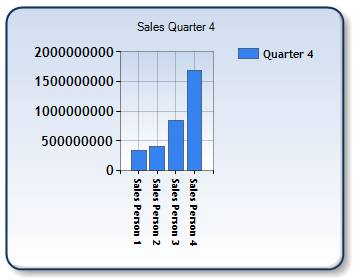 |
| Figure1: The two charts represent the before(left) and after(right) drilldown. |
| Visual Basic |  Copy Code Copy Code |
|---|---|
| |
| C# | Copy Code |
|---|---|
| |