


Overview

Returns the value of the standard normal cumulative distribution. The distribution has a mean of 0 (zero) and a standard deviation of one.
Applying the Formula
All statistical formulas are calculated using the Statistics class, and the following table describes how to use its NormalDistribution method.
| Value/Description | Example | |
|---|---|---|
| Formula Name: | Normal Distribution | Statistics.NormalDistribution (1.96) |
| Parameters: |
|
Statistics.NormalDistribution(1.96) |
| Return: | A double that represents the standard normal cumulative distribution value. |
- |
Statistical Interpretation
The Normal distribution plays a central part in statistical theory. Suppose you make a graph of the probabilities of the numbers of heads you will expect to see if you repeatedly flip a coin 100 times or suppose you select 1000 people of the street and make frequency diagram of their heights. These graphs look similar. Their bell-shaped curve is the most important density function in probability and statistics (see figure below).
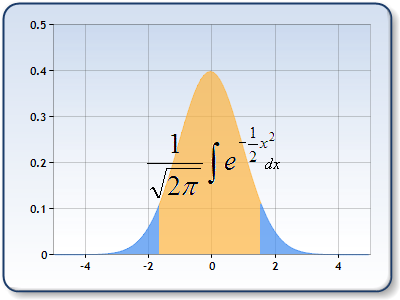
Figure 1: Graph of Standard Normal Distribution.
A random variable whose density function looks like the following is is called a normal random variable:

The parameter  defines where the center, or peak of the distribution will be. This parameter is equal to the mean of distribution. The
  parameter is the variance. By adjusting this value you can determine whether the distribution will be very spread out or whether most of the probability will be concentrated near the peak. A normal random variable with
  and
and  is referred to as a standard normal random variable. Its density function is:

If X and Y are independent normal random variables, then X+Y will also be a normal random variable (with mean  and variance
  ). If you add together many independent identically distributed random variables, the resulting sum will have a Normal distribution. Thats one of the reasons why the normal distribution pops up everywhere. It is called central limit theorem.
Example
This example demonstrates how to calculate the normal distribution.
| Visual Basic |  Copy Code Copy Code |
|---|---|
| |
| C# | Copy Code |
|---|---|
| |
 See Also
Formulas
Formulas Overview
Statistical Formulas
Using Statistical Formulas