Overview
A Pareto chart is a combination of a Column chart, and a Line chart shown
together within the same chart area in order to separate the most vital data points shown. When a large dataset is presented, it is often difficult to determine the most
important points. The Pareto method allows for the visualization of key elements in a dataset, and is useful in situations that require the setting
of priorities in data analysis.
In reality, the Pareto chart type does not exist as a distinct chart type with the charting control because the Pareto Chart is
more of an analysis technique than it is a chart type. However, a Pareto chart can be created by combining a sorted Column chart
with a Line chart that displays a running sum of the percentages of each sorted item in a series.
Since no standard appearance for a Pareto chart exists, you are free to create your Pareto chart with or without the use
of markers, or a Percentage Line. Further, a Pareto chart can also be displayed using values along two axes.
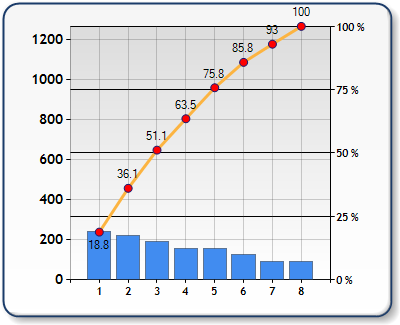
Figure 1: A Pareto chart.
How to Create a Pareto Chart
Assuming a series containing data exists (a source series), the steps required to generate a Pareto chart are:
- Set the source series to be a Column chart type.
- Sort the source series in descending order.
- Find the total value of the points in the source series.
- Use the total value as the maximum value of the Primary Axis.
- Create a new Series (called the destination series) of a Line chart type, and assign it to the same Chart Area as the Series used in step 1
above, however, use the secondary axis for this Series.
- Find the cumulative percent value for each point in the source series, then add that value to the destination series.
Example
This example demonstrates how to create a Pareto chart using one single function call.
| Visual Basic |
 Copy Code Copy Code |
Imports Dundas.Charting.WebControl
   ...

Private Sub MakeParetoChart(ByVal chart As Chart, ByVal srcSeriesName As String, ByVal destSeriesName As String)
    ' Get the name of the ChartArea of the source series.
    Dim strChartArea As String = chart.Series(srcSeriesName).ChartArea

    ' Ensure the source series is a column chart type.
    chart.Series(srcSeriesName).Type = SeriesChartType.Column

    ' Sort the data in the series to be in descending order.
    chart.DataManipulator.Sort(PointsSortOrder.Descending, srcSeriesName)

    ' Find the total of all points in the source series.
    Dim total As Double = 0
    For Each pt As DataPoint In chart.Series(srcSeriesName).Points
        total = (total + pt.YValues(0))
    Next

    ' Set the max.value on the primary axis to the total points value.
    chart.ChartAreas(strChartArea).AxisY.Maximum = total

    ' Create the destination series and add it to the chart.
    Dim destSeries As Series = New Series(destSeriesName)
    chart.Series.Add(destSeries)

    ' Ensure the destination series is a Line or Spline chart type.
    destSeries.Type = SeriesChartType.Line
    destSeries.BorderWidth = 3

    ' Assign the series to the same chart area as the column chart.
    destSeries.ChartArea = chart.Series(srcSeriesName).ChartArea

    ' Set this series to use the secondary axis and set its maximum to 100%.
    destSeries.YAxisType = AxisType.Secondary
    chart.ChartAreas(strChartArea).AxisY2.Maximum = 100

    ' Locale specific percentage format with no decimals.
    chart.ChartAreas(strChartArea).AxisY2.LabelStyle.Format = "P0"

    ' Turn off the end point values of the primary X axis.
    chart.ChartAreas(strChartArea).AxisX.LabelStyle.ShowEndLabels = false

    ' For each point in the source series find % of total and assign it to series data point values.
    Dim percentage As Double = 0

    For Each pt As DataPoint In chart.Series(srcSeriesName).Points
        Dim pos As Integer = 0
        percentage = (percentage + (pt.YValues(0) / (total * 100)))
        pos = destSeries.Points.Add(Math.Round(percentage, 2))
    Next
End Sub
|
| C# |
Copy Code |
using Dundas.Charting.WebControl;
   ...

void MakeParetoChart(Chart chart, string srcSeriesName, string destSeriesName)
{
    // Get the name of the ChartArea of the source series.
    string strChartArea = chart.Series[srcSeriesName].ChartArea;

    // Ensure the source series is a column chart type.
    chart.Series[srcSeriesName].Type = SeriesChartType.Column;

    // Sort the data in the series to be in descending order.
    chart.DataManipulator.Sort(PointsSortOrder.Descending, srcSeriesName);

    // Find the total of all points in the source series.
    double total = 0.0;
    foreach (DataPoint pt in chart.Series[srcSeriesName].Points)
       total += pt.YValues[0];

    // Set the max.value on the primary axis to the total points value.
    chart.ChartAreas[strChartArea].AxisY.Maximum = total;

    // Create the destination series and add it to the chart.
    Series destSeries = new Series(destSeriesName);
    chart.Series.Add(destSeries);

    // Ensure the destination series is a Line or Spline chart type.
    destSeries.Type = SeriesChartType.Line;
    destSeries.BorderWidth = 3;

    // Assign the series to the same chart area as the column chart.
    destSeries.ChartArea = chart.Series[srcSeriesName].ChartArea;

    // Set this series to use the secondary axis and set its maximum to 100%.
    destSeries.YAxisType = AxisType.Secondary;
    chart.ChartAreas[strChartArea].AxisY2.Maximum = 100;

    // Locale specific percentage format with no decimals.
    chart.ChartAreas[strChartArea].AxisY2.LabelStyle.Format = "P0";

    // Turn off the end point values of the primary X axis.
    chart.ChartAreas[strChartArea].AxisX.LabelStyle.ShowEndLabels = false;

    // For each point in the source series find % of total and assign it to series data point values.
    double percentage = 0.0;

    foreach(DataPoint pt in chart.Series[srcSeriesName].Points)
    {
       int pos = 0;
       percentage += (pt.YValues[0] / total * 100.0);
       pos = destSeries.Points.Add(Math.Round(percentage,2));
    }
}
|
 See Also


