


Overview

A Rose Chart is a circular graph, similar to the Radar chart, and used primarily as a data comparison tool. Unlike most other chart types, the Rose chart does not plot an X value. Rose Chart X values are ignored for all Rose chart series. However, even though X values are ignored, the X axis is still used for the labels around the chart, as well as spacings between the label and the chart itself.
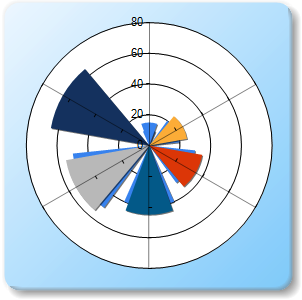
Figure 1: A Rose chart with its RoseDrawingStyle set to Area.
AreaDrawingStyle
The shape of the Rose chart area (which is the white area in the chart images) is determined by the custom attribute, AreaDrawingStyle. You can set the value of this custom attribute to: Circle which is the default, or Polygon. The Polygon shape is shown in Figure 2 below.
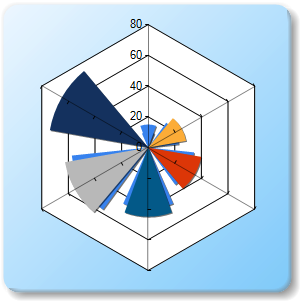 |
| Figure 2: A Rose chart with its AreaDrawingStyle set to Polygon, and its RoseDrawingStyle set to Line. |
Example
This sample demonstrates how to programmatically set the AreaDrawingStyle custom attribute of the chart to show a Polygon.
| Visual Basic |  Copy Code Copy Code |
|---|---|
|
|
| C# | Copy Code |
|---|---|
|
|
RoseDrawingStyle
There are two styles used to draw the Rose chart. These styles are defined by RoseDrawingStyle custom attribute, which can be set to a value of Area, or Line. This custom attribute defines how a series is displayed within your Rose chart.
|
RoseDrawingStyle |
Description |
|
Area |
Setting to this value will cause the chart to use the Horizontal style if the number of sectors is low, otherwise a style value of Radial will be used. When this drawing style is used, the data that is within the data Series will be displayed as a solid filled area. |
|
Line |
Labels will be positioned in a circular fashion around the chart area, and the data that is within that data Series will be displayed as an area outline. |
Example
This example demonstrates how to set a chart's data Series' RoseDrawingStyle for each one of its two data Series.
| Visual Basic | Copy Code |
|---|---|
|
|
| C# | Copy Code |
|---|---|
|
|
Area3DStyle
The Rose chart area does not support real 3D. The only property from the Area3DStyle object that affects the Rose chart is the Enable3D property. By setting Enable3D to True, the drawing style of the area background changes to give the appearance of looking down on a 3D circle or polygon. No rotation, or any other 3D properties are applicable.
 |
|
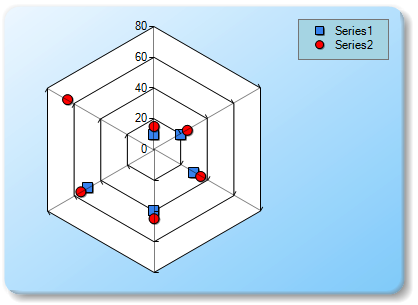
Figure 3: A 3D Rose chart with its AreaDrawingStyle set to Circle, and its RoseDrawingStyle set to Area. |
Axis Labels
The textual value for the axis labels can be explicitly set for the Rose chart using the AxisLabel property for each data point. Alternatively, custom axis labels may be defined using the CustomLabels collection of the X axis. If custom labels are set, they have higher priority over any other labels. When using custom axis labels, only the Text property of the custom label, and its index in the collection are important. The To and From properties are ignored.
The X axis object can also be used to control the distance between the chart area and its circular labels by changing the X axis MajorTickmark.Size property.
Example
This example demonstrates how to set the tick mark size property using the MajorTickMark.Size attribute.
| Visual Basic | Copy Code |
|---|---|
|
|
| C# | Copy Code |
|---|---|
|
|
Rose Chart Limitations
When using the Rose Chart, it is worthwhile to note that there is no support for StripLines, nor is there any support for Cursors, Zooming, or Scrolling.
|
Chart Details |
|
|---|---|
|
Number of Y values per point: |
1 |
|
Number of series: |
One |
|
Support markers: |
Yes |
|
Cannot be combined with: |
Doughnut, Pie, Bar |
|
Custom Attributes |
|---|