


Overview
Dundas Chart for ASP.NET uses powerful AJAX technology to deliver unprecedented highlighting, scrolling, and zooming functionality to all of your web applications. Zooming and scrolling is made possible by using data views. These dataviews allow the Chart to display a subset of its data for increased readability, and analysis.
 |
Scrolling and Zooming functionality is not available when using 3D charts. |
Data Views
A data view is supported by the AxisDataView class, which is exposed via the Axis class' View property. A view has a Size, Position and SizeType which determines the subset of data that it displays.
 |
| Figure 1: Position and Size of a Data View. |
There are three different ways to display a view:
- By setting the Size, Position, and SizeType properties of an AxisDataView object directly.
- As a result of a zooming operation caused by the end-user clicking and dragging the left-mouse button.
- As a result of calling the overloaded Zoom method.
The MinSize property sets the minimum size of a view. This only affects end-user zooming (as opposed to zooming programmatically), and once the minimum size has been reached, the size of the view will not decrease; regardless of any further zooming by the end-user. By default, MinSize is not set (represented by the Double.NaN value), and the unit of measurement for MinSize is determined by the MinSizeType value.
For end-user zooming to be enabled along an axis, the relevant cursor object's UserEnabled property must be set to true.
Resetting A Data View
A data view can be reset either by an end-user, or at runtime programmatically. Every time an end-user zooms in on data, the previous view is saved. When the end-user clicks on the ZoomReset button, the previous view is displayed. When zooming in on data, using the overloaded Zoom method, it is up to you to save the previous view (depending on the Zoom definition used). When resetting a view, using the overloaded ZoomReset method, any of the saved views can be displayed; including the originally displayed data (i.e. no zooming).
Axis Values and Margins
To retrieve the maximum and minimum axis values of a view, use the GetViewMaximum and GetViewMinimum methods.
If Axis.Margin is set to true, then margins will be displayed. However, axis margins will affect what is displayed in your data views.
Zooming
To zoom in on data, end-user must click within a chart area, and drag their left-mouse button to highlight an area as shown in Figure 2 below. The result of a zoom operation is the display of a view, along with any accompanying scrollbars.
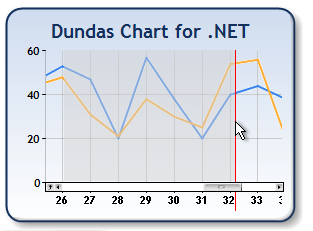 |
| Figure 2: Zooming in on the chart data. |
To zoom in on a data range, the UserEnabled property of the CursorX and CursorY properties must be set to true.
When zooming occurs as a result of end-user interaction, the resulting size of a view may be limited, and depends on the View.MinSize property value set. If this property value is not set (has a value of Double.NaN) then no minimum view size will be used.
Example
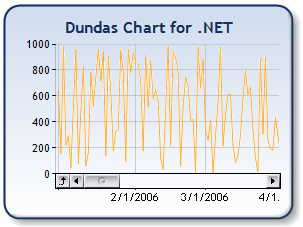
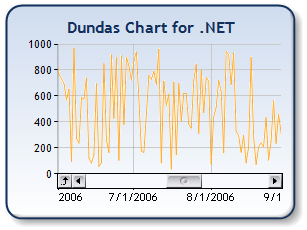
This example demonstrates how create a chart that contains one year of sales data for two products. Then using this chart, we demonstrate how to zoom in and view only the data for the month of May. Here we assume that a button was added to the form to handle this behavior.
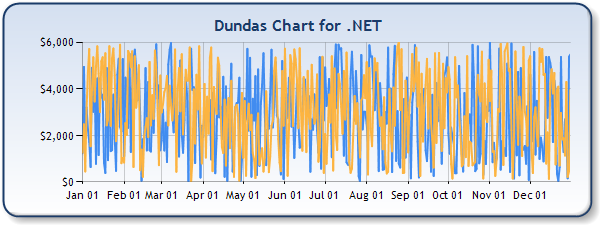 |
| Figure 3: The chart containing one year of data. |
| Visual Basic |  Copy Code Copy Code |
|---|---|
| |
| C# | Copy Code |
|---|---|
| |
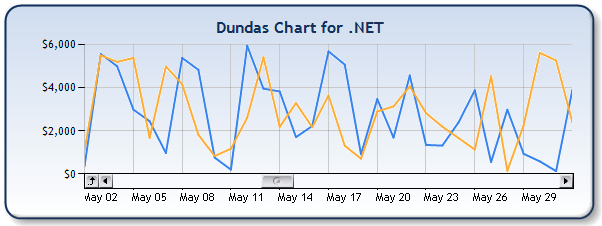 |
| Figure 4: The resulting chart is displayed below. |
Using the Zoom Method
Programmatic zooming can also be accomplished using the overloaded Zoom method. The start and end axis positions of the new view may be specified, or the position and size of a view can be specified. Also, the size and position of the current view can optionally be saved before displaying zooming.
Example
This example demonstrates how to zoom in on data with a given data view position, and size. We assume that a series is being plotted in a chart area named "Default", and that the series has DateTime X value types. We also save the state of the previous view.
| Visual Basic | Copy Code |
|---|---|
| |
| C# | Copy Code |
|---|---|
| |
Scrolling
Scrollbars are represented by the AxisScrollBar class, which is exposed via the ScrollBar property. This AxisScrollBar class controls the appearance of scrollbars, setting such things as the color of arrows and symbols via the LineColor property, the background color of the scrollbar via the BackColor property and which buttons are displayed (e.g. zoom reset button, left/right and up/down buttons, etc.) via the Buttons property. AxisScrollBar also enables/disables a scrollbar using the Enabled property. However, even if a scrollbar is enabled it may not be displayed since it will only be displayed if the axis that it belongs is displaying an associated data view.
Scrolling Options
Scrolling can occur by either the end-user using a scrollbar or programmatically by calling the overloaded Scroll method.
When the end-user clicks on an up/down or right/left button, the chart image will scroll by one pixel. When the end-user clicks on the background of a scrollbar (i.e. not on the thumb bar, but beside the thumb bar), the scrolling size is represented by the Size property. Since zooming results in a smaller size of view being displayed, the "scrolling size" decreases after each zoom. To limit this behavior, use the MinSize property to set a minimum scrolling size.
Call the Scroll method when scrolling programmatically. Scrolling does not change the size of a view, rather, it changes the position of a view. When calling the Scroll method, the developer has the option of scrolling to a specified location along an axis, using a definition that takes a newPosition parameter.
Example
We have a scrollable chart that starts at January 1, 2006. We wish to scroll programmatically to June 1, 2006 and show 90 days worth of data on the chart.
|
| Figure 5: Programmatically scrolling the chart to show 90 days worth of data. |
| Visual Basic | Copy Code |
|---|---|
| |
| C# | Copy Code |
|---|---|
| |
 |
| Figure 6: The resulting chart. |
Scrolling Events
The charting control provides you with a ChartScroll event that fires when the chart has been scrolled. This event can be used in concert with a number of other Chart properties including:
- ChartArea: The chart area being scrolled.
- Axis: The axis being scrolled.
- UpdateChart: A boolean value that is set to update the client side chart image.
- ChartScrollTimeout: This is a value set in milliseconds, that defines the interval at which a callback to the server (in regards to the server side chart scroll event) will occur. If multiple chart scrolls occur during this time frame, then the last scroll to occur before the time expires will be the one sent in a callback to the server. This is done to avoid excessive trips to the server.
Example
This example demonstrates how to use the ChartScroll event.
| Visual Basic | Copy Code |
|---|---|
|
Protected Sub Page_Load(ByVal sender As Object, ByVal e As EventArgs) ' Wire up the event handler. AddHandler Chart1.ChartScroll, AddressOf Chart1_ChartScroll ' Set the timeout parameter. Chart1.ChartScrollTimeout = 1000 End Sub ' Scroll event handler. Private Sub Chart1_ChartScroll(ByVal sender As Object, ByVal e As Chart.ChartScrollEventArgs) Dim chart As Chart = DirectCast(sender, Chart) ' Set the timeout property to a new value of ' 2000 ms. chart.ChartScrollTimeout = 2000 ' This code causes a repaint (update) of the Chart control, ' and also sets the new delay (2000 ms) for the next occurrence ' of the ChartScroll event. e.UpdateChart = True ' This code does NOT cause a repaint (update) of the Chart control, which ' means that the delay for the next occurrence of the ChartScroll event ' will remain at 1000 ms. e.UpdateChart = False ' Using the UpdateClientControl method you can update another ' client charting control. Here this chart is called myChartObj, ' and we are updating its Table1 member. chart.CallbackManager.UpdateClientControl(myChartObj.Table1) End Sub | |
| C# | Copy Code |
|---|---|
|
protected void Page_Load(object sender, EventArgs e) { // Wire up the event handler. Chart1.ChartScroll += new Chart.ChartScrollEventHandler(Chart1_ChartScroll); // Set the timeout parameter. Chart1.ChartScrollTimeout = 1000; } ... // Scroll event handler. void Chart1_ChartScroll(object sender, Chart.ChartScrollEventArgs e) { Chart chart = (Chart)sender; // Set the timeout property to a new value of // 2000 ms. chart.ChartScrollTimeout = 2000; // This code causes a repaint (update) of the Chart control, // and also sets the new delay (2000 ms) for the next occurrence // of the ChartScroll event. e.UpdateChart = true; // This code does NOT cause a repaint (update) of the Chart control, which // means that the delay for the next occurrence of the ChartScroll event // will remain at 1000 ms. e.UpdateChart = false; // Using the UpdateClientControl method you can update another // client charting control. Here this chart is called myChartObj, // and we are updating its Table1 member. chart.CallbackManager.UpdateClientControl(myChartObj.Table1); } | |
Labeling
Here are some suggestions when setting axis labels in conjunction with the scrolling and zooming feature:
- It is advised to set the LabelsAutoFit to true. If this property is false, the labels will be fixed in size, and changing the axis view may cause labels to be cut off.
- It is advised to set the InnerPlotPosition property to Auto. Setting the inner plot position to a fixed size may cause labels to overlap.
- The Chart will disable anti-aliasing if you have specified a transparent value for the chart background. We advise you to avoid gradients or setting alpha values when drawing the chart area background.
Some Points to Consider
The following are some points to note when using the scrolling and zooming features:
- Chart elements that are placed inside the chart area will not be re-drawn when scrolling or zooming.
- You may experience unpredictable behavior when enabling SmartLabels™.
- In situations where there are large differences between axis label lengths, we advise that you set the inner chart area position to a fixed value.
- This feature is only available when using AJAX-enabled browsers (Internet Explorer 5+, Firefox, Mozilla, Opera, Netscape 6.1+).
- The ChartHttpHandler key must be in the appSettings node of the web application's configuration file.
- ASP.NET sessions must be enabled.
Scrolling and zooming are not supported when using the following Chart-related features:
- Non-linear chart types (pie, doughnut, radar, etc.).
- 3-D charts.
- Labels auto fitting.
- Secondary axes.
- Logarithmic Scale.