


Overview
Dundas Chart for ASP.NET harnesses the new features and improvements of the Microsoft Visual Studio 2005 and 2008 development environments. These development environments provide you with many unique design-time abilities for designing and building your charts. This article will introduce the major enhancements of this latest release of the chart control, and will discuss how these improvements allow you to take full advantage of the features found in Visual Studio 2005, as well as the new features of Visual Studio 2008.
Using Smart-Tags (Visual Studio 2005/2008)
One of the most useful features of these latest releases of Visual Studio is the Smart-Tags feature. Dundas Chart for ASP.NET provides smart-tags for all of its major chart elements. Smart-tags reduce the number of clicks needed at design-time to complete common chart tasks. When a chart element is selected, a list of that element's common properties is displayed for you in a fly-out menu style.
The smart-tag can be expanded, or collapsed, by clicking the smart-tag icon in the top-right corner of the chart component as shown in Figure 1 below.
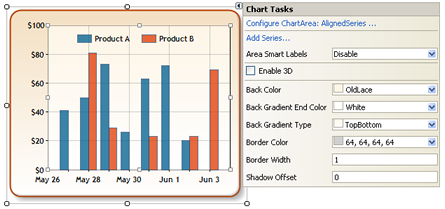
Figure 1: Using Smart-tags streamlines your development process.
High-Level Data Binding
These latest releases of Visual Studio 2005/2008 give you option of binding the chart to a data control instead of binding the chart directly to a database. Your charts are allowed to data bind quickly and efficiently, allowing for greater encapsulation and more control within an application.
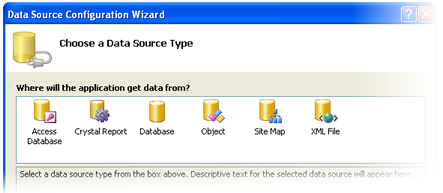
Figure 2: You can data-bind the chart control to many different data sources.
For more information on how to data-bind in Visual Studio 2005/2008, please refer to the Data Binding topic.
Simplified Debugging
Debugging visualizers are a new user interface component of the Visual Studio 2005 debugger. When an application is running in debug mode, the chart uses the debugging visualizer to provide advanced, fully customizable, data display of chart objects.
To open the chart visualizer:
- Run the application in debug mode by clicking Debug | Start Debugging.
- From the Watch window, click on the magnifying glass icon that appears next to the chart variable name as shown, circled in red, in Figure 3 below.
- A pop-up list of visualizers may be displayed. Click on the Chart Series Visualizer to view the points in the series.

Figure 3: Use the Magnifying Glass Icon, shown circled in red, to display Chart Visualizers.
The visualizer creates a dialog box, or other interface, to display a chart variable in a meaningful way that is appropriate to its data type (e.g. data points visualizer will display a list of X, Y values for a series of points, image visualizer will display a graphic for the chart image it represents, etc.).
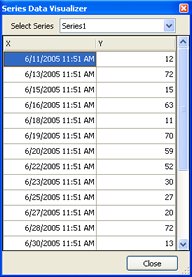
Figure 4: Chart Series Visualizer.
You can also use the debugger display in order to view key attributes of a chart variable by making use of the Watch window, or DataTips. For example, if a series is viewed in the Watch window, the debugger displays the series' name, corresponding chart area, type, and data point count as shown, circled in red, in Figure 5 below. Most chart objects can have their attributes displayed using this method.

Figure 5: Debug display showing the chart series' visualizers.
 See Also
Getting Started
Quick Start
Programming Techniques