


Overview

Returns the probability for the T distribution (student's distribution).
Applying the Formula
All statistical formulas are calculated using the Statistics class, and the following table describes how to use its TDistribution method.
| Value/Description | Example | |
|---|---|---|
| Formula Name: | T Distribution | Statistics.TDistribution (1.96, 30, true) |
| Parameters: |
|
Statistics.TDistribution(1.96, 30, true) |
| Return: | A double that represents the T cumulative distribution function probability. |
- |
Statistical Interpretation
Another important distribution that is related to the normal distribution is the t distribution. Suppose that Z and Y are independent random variables. Let Z be a standard normal random variable (mean of 0, variance of 1). And Y a chi-square variable with m degrees of freedom.
Let us make the definition:

Then it is said that the variable T has the t distribution with m degrees of freedom (The t distribution is sometimes called Students distribution).
Looking at the form of the density function provides some clues about the nature of the t distribution. Since g(x) = g(-x), it follows that the density function is symmetric about x = 0. The maximum value of g(x) occurs when x = 0:
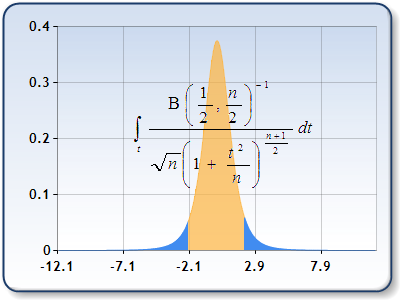
Figure 1: T distribution.
The density function has a bell shape that is roughly similar to the standard normal distribution. A t random variable has a higher chance of being far from 0 than does a standard normal random variable. However, as the number of degrees of freedom increases the t distribution approaches very close to the standard normal distribution.
Example
The following sample calculates the T distribution probability.
| Visual Basic |  Copy Code Copy Code |
|---|---|
| |
| C# | Copy Code |
|---|---|
| |
 See Also
Formulas
Formulas Overview
Statistical Formulas
Using Statistical Formulas