Overview

Performs a T Test using Students distribution (T distribution) with paired samples. This is useful when there is a natural pairing of observations in samples, like for instance, when a sample group is tested twice.
Applying the Formula
All statistical formulas are calculated using the Statistics class, and the following table describes how to use its TTestPaired method to perform this test.
| |
Value/Description |
Example |
| Formula Name: |
T Test Paired |
Statistics.TTestPaired (0.2,0.05,"Series1","Series2") |
| Parameters: |
- hypothesizedMeanDifference: the hypothesized difference between the means of the data groups.
- probability: the alpha value (probability).
- firstInputSeriesName: The name of the Series object that stores the first group of data.
- secondInputSeriesName: The name of the Series object that stores the second group of data.
|
Statistics.TTestPaired(0.2, 0.05, "Series1", "Series2") |
| Return: |
A TTestResult object, which has the following members:
- FirstSeriesMean
- SecondSeriesMean
- FirstSeriesVariance
- SecondSeriesVariance
- TValue
- DegreeOfFreedom
- ProbabilityTOneTail
- TCriticalValueOneTail
- ProbabilityTTwoTail
- TCriticalValueTwoTail
|
- |
 Note Note |
| Make sure that all data points have their XValue property set, and that their series' XValueIndexed property has been set to false. |
Statistical Interpretation
Suppose that you have two different populations whose means you want to compare. Assume that the random variables  (mean
(mean  , variance
  ) and
) and  (mean
(mean  , variance
  ) have approximately normal distributions. For sample sizes of
  and
and  , then the sample means
  and
and  are normal random variables. Assume that the difference in scores between and comes from a normal distribution with mean
  and variance
  . The null hypothesis is that
  , and to calculate the T value:
  .
.
Here  is the sample standard deviation for the differences and D is the mean difference.
Example
This example demonstrates how to perform a t test with paired samples, represented by Series1 and Series2. The results are returned in a TTestResult object.
| Visual Basic |
 Copy Code Copy Code |
Imports Dundas.Charting.WebControl
  ...

' Perform the test.
Dim result As TTestResult = Chart1.DataManipulator.Statistics.TTestPaired(0.2,0.05,"Series1","Series2")
|
| C# |
Copy Code |
using Dundas.Charting.WebControl;
  ...

// Perform the test.
TTestResult result = Chart1.DataManipulator.Statistics.TTestPaired(0.2,0.05,"Series1","Series2");
|
Example
This example demonstrates how to perform a t test with paired samples, represented by Series1 and Series2. The results are returned in an TTestResult object. The object values are then added as titles to a separate chart. We assume series data was added at design-time. Further, we assume a "DundasBlue" template was applied for appearance purposes.
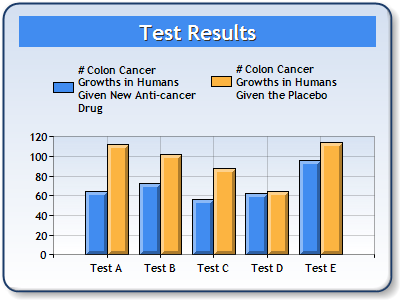 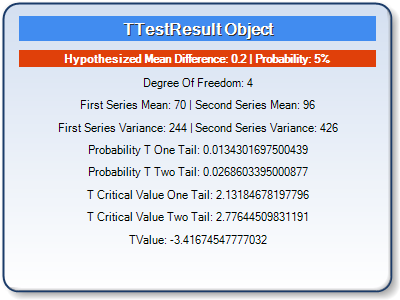 |
| Figure 1: Two Charts; One containing Series data (left), and the other containing the TTestResult object (right). |
| Visual Basic |
Copy Code |
Imports Dundas.Charting.WebControl
  ...

' Perform the test.
Dim ttestresult As TTestResult =  chart1.DataManipulator.Statistics.TTestPaired(0.2,0.05,
"Series1","Series2")

' Add Title to second chart.
chart2.Titles.Add("TTestResult Object")
chart2.Titles.Add("Hypothesized Mean Difference: 0.2 | Probability: 5%")

' Change Appearance properties of first title.
chart2.Titles(0).BackColor = Color.FromArgb(255, 65, 140, 240)
chart2.Titles(0).Font = New Font("Trebuchet", 12, FontStyle.Bold)
chart2.Titles(0).Color = Color.White
chart2.Titles(0).Style = TextStyle.Shadow

' Change Appearance properties of second title.
chart2.Titles(1).BackColor = Color.FromArgb(255, 224, 64, 10)
chart2.Titles(1).Font = New Font("Trebuchet", 8, FontStyle.Bold)
chart2.Titles(1).Color = Color.White

' Add Data from TTestResult Object
chart2.Titles.Add("Degree Of Freedom: " + ttestresult.DegreeOfFreedom.ToString())
chart2.Titles.Add("First Series Mean: " + ttestresult.FirstSeriesMean.ToString() +
" | Second Series Mean: " + ttestresult.SecondSeriesMean.ToString())
chart2.Titles.Add("First Series Variance: " + ttestresult.FirstSeriesVariance.ToString() +
" | Second Series Variance: " + ttestresult.SecondSeriesVariance.ToString())
chart2.Titles.Add("Probability T One Tail: " + ttestresult.ProbabilityTOneTail.ToString())
chart2.Titles.Add("Probability T Two Tail: " + ttestresult.ProbabilityTTwoTail.ToString())
chart2.Titles.Add("T Critical Value One Tail: " + ttestresult.TCriticalValueOneTail.ToString())
chart2.Titles.Add("T Critical Value Two Tail: " + ttestresult.TCriticalValueTwoTail.ToString())
chart2.Titles.Add("TValue: " + ttestresult.TValue.ToString())
|
| C# |
Copy Code |
|
| C# |
Copy Code |
using Dundas.Charting.WebControl;
  ...

// Perform the test.
TTestResult ttestresult = chart1.DataManipulator.Statistics.TTestPaired(0.2, 0.05,
"Series1", "Series2");

// Add Title to second chart.
chart2.Titles.Add("TTestResult Object");
chart2.Titles.Add("Hypothesized Mean Difference: 0.2 | Probability: 5%");

// Change Appearance properties of first title.
chart2.Titles[0].BackColor = Color.FromArgb(255, 65, 140, 240);
chart2.Titles[0].Font = new Font("Trebuchet", 12, FontStyle.Bold);
chart2.Titles[0].Color = Color.White;
chart2.Titles[0].Style = TextStyle.Shadow;

// Change Appearance properties of second title.
chart2.Titles[1].BackColor = Color.FromArgb(255, 224, 64, 10);
chart2.Titles[1].Font = new Font("Trebuchet", 8, FontStyle.Bold);
chart2.Titles[1].Color = Color.White;

// Add Data from TTestResult Object
chart2.Titles.Add("Degree Of Freedom: " + ttestresult.DegreeOfFreedom.ToString());
chart2.Titles.Add("First Series Mean: " + ttestresult.FirstSeriesMean.ToString() +
" | Second Series Mean: " + ttestresult.SecondSeriesMean.ToString());
chart2.Titles.Add("First Series Variance: " + ttestresult.FirstSeriesVariance.ToString() +
" | Second Series Variance: " + ttestresult.SecondSeriesVariance.ToString());
chart2.Titles.Add("Probability T One Tail: " + ttestresult.ProbabilityTOneTail.ToString());
chart2.Titles.Add("Probability T Two Tail: " + ttestresult.ProbabilityTTwoTail.ToString());
chart2.Titles.Add("T Critical Value One Tail: " + ttestresult.TCriticalValueOneTail.ToString());
chart2.Titles.Add("T Critical Value Two Tail: " + ttestresult.TCriticalValueTwoTail.ToString());
chart2.Titles.Add("TValue: " + ttestresult.TValue.ToString());
|
 See Also


