Overview

When using data point labels with charts having many points, it is possible that the labels will collide. Such collisions make the chart unreadable.
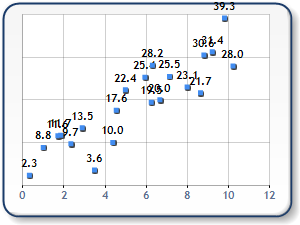
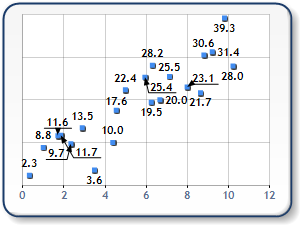
Figure 1: An unreadable, labeled chart (shown left) and is transformed using SmartLabels (shown right).
Using SmartLabels™
Use of the SmartLabels™ technology helps overcome these issues by repositioning the labels based on a set of user-defined rules. These properties are available as part of the Series Collection.
SmartLabels™ rules include properties that control when and the distance in allowed directions to reposition a data point label. The appearance of the callout lines can also be controlled using the SmartLabels™ object.

Figure 2: SmartLabels™ properties.
SmartLabels™ are supported for most chart types except for the following:
- Bar Chart.
- Gantt Chart.
- Pie Chart.
- Doughnut Chart.
- Range Column Chart.
- Stacked Area Charts.
- 100% Stacked Area Charts.
- Stacked Bar Charts.
- 100% Stacked Bar Charts.
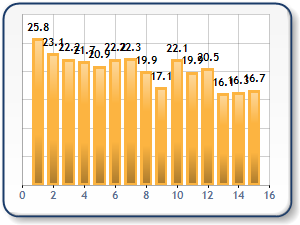
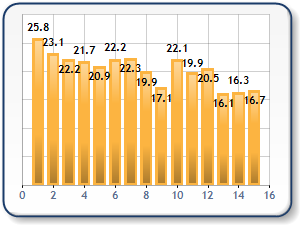
Figure 3: Improving a labeled column chart (shown left) by enabling SmartLabels™ (shown right).
SmartLabels™ take precedence when the data point label is explicitly set to any angle other than 0 degrees. When the label angle is set to anything other than zero, the label will be forced to an angle of zero.
Enabling SmartLabels™
By default, the SmartLabels™ are disabled. Enabling this feature can be done by setting the Enabled property to true. The default behavior for SmartLabels™ will normally suffice for most chart users. However, further customizations will provide a greater level of control, and will provide more attractive and readable charts.
Using Callout Lines
SmartLabels™ will first try repositioning an overlapping data point label as near as possible to the data point itself. However, when many adjacent points, and labels exist it becomes difficult, if not impossible, to move the label to a point next to the data point. The chart will move the data point label to a valid free space. Callout lines will be drawn to link the label with its data point.
Like all chart elements, the callout line's visual attributes can be controlled. These visual attributes include color, line style, and line width. The CalloutStyle, and CalloutLineAnchorCap properties control the decorations, like arrow heads, at the end of the callout line.
The CalloutLineColor property can be set to any Color object. Setting the color of the line will also set the color of the CalloutLineAnchorCap and the decoration defined by the CalloutStyle.
The CalloutLineWidth property controls the pixel width of the callout line. Use of this property will also scale the decorations of the CalloutLineAnchorCap and the CalloutStyle.
The line style of the callout line can be controlled using the CalloutLineStyle. The line style can be set to one of several available styles which include solid, dashed and dotted lines.
CalloutStyle Property
The CalloutStyle defines what is displayed at the end of a callout line. By default, this is a horizontal line that is drawn from the callout line that, in most cases, appears to underline the data point label.
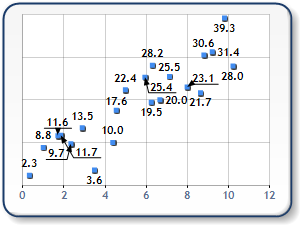
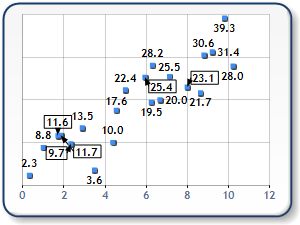
Figure 4: Callout Style comparison (Underline and Box styles).
Possible values for the CalloutStyle are defined in the LabelCalloutStyle enumeration, and include:
|
Member Name |
Description |
|---|---|
|
None |
Label callout line will terminate without any added style. |
|
Underline |
Label callout line will terminate with horizontal line beneath the label text. |
|
Box |
Label callout line will terminate to box around the label text. |
Example
This example demonstrates how to set various properties, related to the callout line, when defining SmartLabels.
| Visual Basic |  Copy Code Copy Code |
|---|---|
| |
| C# |  Copy Code Copy Code |
|---|---|
| |
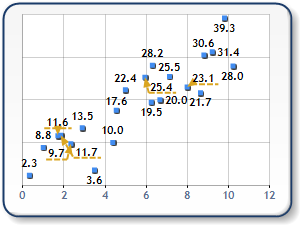
Figure 5: After applying various Callout properties.
Controlling Label Movement
The movement of the SmartLabels™ can be controlled through the use of several moving related properties. These define the rules of movement for the direction, distance and whether the data point label is allowed to leave the plotting area. The default movement rules will normally resolve most issues.
If the point cannot be drawn within the region specified by the properties MinMovingDistance and MaxMovingDistance in the directions allowed by the MovingDirections, and the HideOverlapped property is true then the data point label will not be drawn.
MovingDirections Property
The MovingDirections property defines the allowable direction(s) that the data point label is allowed to be moved. This property accepts LabelAlignment value or multiple bitwise OR'd LabelAlignment values. The default is the bitwise OR of all LabelAlignment values to allow repositioning in all directions except to the center of the data point.
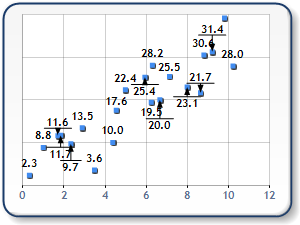
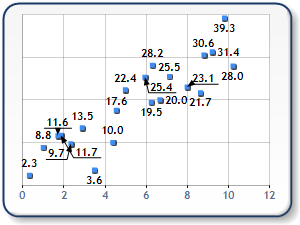
Figure 6: Top/Bottom Moving Directions (shown left); All Moving Directions (shown right).
MinMoving Distance and MaxMovingDistance Property
The MaxMovingDistance defines a value that specifies the maximum distance in pixels from the data point that data point labels are allowed to be moved in case of overlapping.
The MinMovingDistance property defines a value that specifies the minimum distance in pixels from the data point that data point labels will be moved in case of overlapping. When a data point label needs to be repositioned, the label will be moved by at least the number of pixels specified.
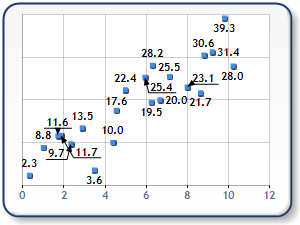
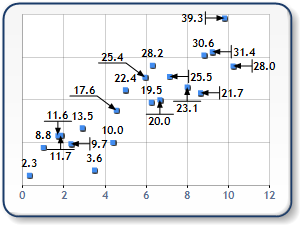
Figure 7: MinMovingDistance set to 0 pixels (shown left) and 10 pixels (shown right)
AllowOutsidePlotArea Property
The AllowOutsidePlotArea property sets a LabelOutsidePlotAreaStyle value that specifies the extent of how the datapoint labels should be drawn with respect to the plotting area. The default value is LabelOutsidePlotAreaStyle.Partial.
When applying SmartLabels™ the drawing outside of labels is only used to provide an option as the chart will only draw outside if the labels cannot be drawn elsewhere without overlapping.
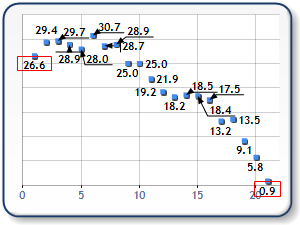
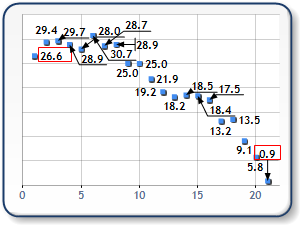
Figure 8: AllowOutsidePlotArea enabled (shown left) and disabled (shown right).
Possible values for the LabelsOutsidePlotAreaStyle enum are:
|
Member Name |
Description |
|---|---|
|
Yes |
Labels are allowed to leave the plotting area if necessary. |
|
No |
Labels are NOT allowed to leave the plotting area. |
|
Partial |
Labels are allowed to leave the plotting area if necessary but no more than 50% of the label cannot be drawn outside the plotting area. |
Example
This example demonstrates how to set various SmartLabels properties that are related to label movement and placement.
| Visual Basic |  Copy Code Copy Code |
|---|---|
| |
| C# |  Copy Code Copy Code |
|---|---|
| |
Using Overlapping Properties
HideOverlapped Property
The HideOverlapped property is a boolean value that specifies the allowance of hiding labels when overlapping issues cannot be resolved.
If the point cannot be drawn within the region specified by the properties MinMovingDistance and MaxMovingDistance in the directions allowed by the MovingDirections, and the HideOverlapped property is true, then the data point label will not be drawn.
MarkerOverlapping Property
The MarkerOverlapping property is a boolean value that specifies whether the point labels are allowed to overlap a point marker. By default, this property is set to false to ensure that the labels remain as clear as possible. In cases where the rendered chart has a significant number of data point labels to display, setting the property to true may loosen the rules enough for more point labels to be drawn.
Limitations
If Scrolling and Zooming are used, SmartLabels™ will not respond correctly.


