Overview

This formula performs a Z Test using Normal distribution.
Applying the Formula
All statistical formulas are calculated using the Statistics class, and the following table describes how to use its ZTest method to perform a Z Test.
| |
Value/Description |
Example |
| Formula Name: |
Z Test |
Statistics.ZTest (0.2, 2.5, 4.5, 0.05, "Series1", "Series2") |
| Parameters: |
- hypothesizedMeanDifference: the hypothesized difference between the means of the data groups.
- varianceFirstGroup: the variance within the first group of data.
- varianceSecondGroup: the variance within the second group of data.
- probability: the alpha value (probability that the hypothesis is rejected).
- firstInputSeriesName: The name of the Series object that stores the first group of data.
- secondInputSeriesName: The name of the Series object that stores the second group of data.
|
Statistics.ZTest(0.2, 2.5, 4.5, 0.05, "Series1", "Series2") |
| Return: |
A ZTestResult object, which has the following members:
- FirstSeriesMean
- SecondSeriesMean
- FirstSeriesVariance
- SecondSeriesVariance
- ZValue
- ProbabilityZOneTail
- ZCriticalValueOneTail
- ProbabilityZTwoTail
- ZCriticalValueTwoTail
|
- |
 Note Note |
| Make sure that all data points have their XValue property set, and that their series' XValueIndexed property has been set to false. |
Statistical Interpretation
Suppose that you have two different populations whose means you want to compare. Assume that the random variables  (mean
(mean  , variance
  ) and
) and  (mean
(mean  , variance
  ) have approximately normal distributions. For sample sizes of
  and
and  , then the sample means
  and
and  are normal random variables.
If we want to test hypotheses about the difference between the population means  , our null hypothesis might be that the population means are equal:
 or
or  .
.
If the population variances  and
and  are known, we can form the test statistic Z:
This statistic will have a standard normal distribution if the null hypothesis is true.
Calculation
- Calculate
 and
and  .
.
- Calculate the Z statistic:

- Use the Normal Inverse Distribution function to test the hypothesis.
Example
This example demonstrates how to perform a Z Test, using Series1 and Series2 for the input series.
| Visual Basic |
 Copy Code Copy Code |
Imports Dundas.Charting.WebControl
  ...

' Perform the Z test.
Dim result As ZTestResult = Chart1.DataManipulator.Statistics.ZTest(0.2,2.5,4.5,0.05,"Series1","Series2")
|
| C# |
Copy Code |
using Dundas.Charting.WebControl;
  ...

// Perform the Z test.
ZTestResult result = Chart1.DataManipulator.Statistics.ZTest(0.2,2.5,4.5,0.05,"Series1","Series2");
|
Example
This example demonstrates how to perform a Z Test, using Series1 and Series2 for the input series. The results are returned in an ZTestResult object. The object values are then added as titles to a separate chart. We assume series data was added at design-time. Further, we assume a "DundasBlue" template was applied for appearance purposes.
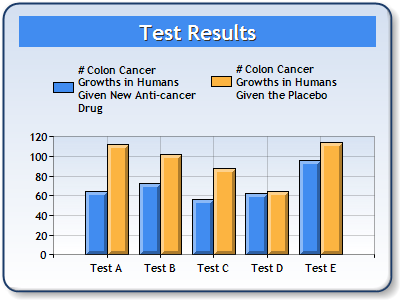 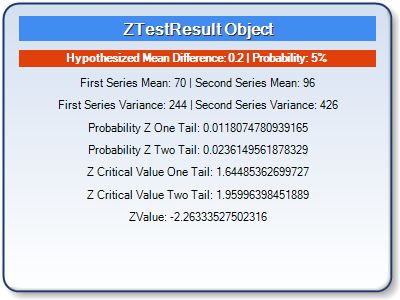 |
| Figure 1: Two Charts; One containing Series data (left), and the other containing the ZTestResult object (right). |
| Visual Basic |
Copy Code |
Imports Dundas.Charting.WebControl
  ...

ZTestResult ztestresult = chart1.DataManipulator.Statistics.ZTest(0.2,
        chart1.DataManipulator.Statistics.Variance("Series1",True),
        chart1.DataManipulator.Statistics.Variance("Series2",True),
        0.05,
        "Series1",
        "Series2"
        )

' Inital Titles are added.
chart2.Titles.Add("ZTestResult Object")
chart2.Titles.Add("Hypothesized Mean Difference: 0.2 | Probability: 5%\n")

' Change Appearance properties of first title.
chart2.Titles(0).BackColor = Color.FromArgb(255, 65, 140, 240)
chart2.Titles(0).Font = New Font("Trebuchet", 12, FontStyle.Bold)
chart2.Titles(0).Color = Color.White
chart2.Titles(0).Style = TextStyle.Shadow

' Change Appearance properties of second title.
chart2.Titles(1).BackColor = Color.FromArgb(255, 224, 64, 10)
chart2.Titles(1).Font = New Font("Trebuchet", 8, FontStyle.Bold)
chart2.Titles(1).Color = Color.White

' ZTestObject properties are created into titles using the ToString() method.
chart2.Titles.Add("First Series Mean: " + ztestresult.FirstSeriesMean.ToString() +
" | Second Series Mean: " + ztestresult.SecondSeriesMean.ToString())
chart2.Titles.Add("First Series Variance: " + ztestresult.FirstSeriesVariance.ToString() +
" | Second Series Variance: " + ztestresult.SecondSeriesVariance.ToString())
chart2.Titles.Add("Probability Z One Tail: " + ztestresult.ProbabilityZOneTail.ToString())
chart2.Titles.Add("Probability Z Two Tail: " + ztestresult.ProbabilityZTwoTail.ToString())
chart2.Titles.Add("Z Critical Value One Tail: " + ztestresult.ZCriticalValueOneTail.ToString())
chart2.Titles.Add("Z Critical Value Two Tail: " + ztestresult.ZCriticalValueTwoTail.ToString())
chart2.Titles.Add("ZValue: " + ztestresult.ZValue.ToString())
|
| C# |
Copy Code |
using Dundas.Charting.WebControl;
  ...

ZTestResult ztestresult = chart1.DataManipulator.Statistics.ZTest(0.2,
        chart1.DataManipulator.Statistics.Variance("Series1",true),
        chart1.DataManipulator.Statistics.Variance("Series2",true),
        0.05,
        "Series1",
        "Series2"
        );

// Inital Titles are added.
chart2.Titles.Add("ZTestResult Object");
chart2.Titles.Add("Hypothesized Mean Difference: 0.2 | Probability: 5%\n");

// Change Appearance properties of first title.
chart2.Titles[0].BackColor = Color.FromArgb(255, 65, 140, 240);
chart2.Titles[0].Font = new Font("Trebuchet", 12, FontStyle.Bold);
chart2.Titles[0].Color = Color.White;
chart2.Titles[0].Style = TextStyle.Shadow;

// Change Appearance properties of second title.
chart2.Titles[1].BackColor = Color.FromArgb(255, 224, 64, 10);
chart2.Titles[1].Font = new Font("Trebuchet", 8, FontStyle.Bold);
chart2.Titles[1].Color = Color.White;

// ZTestObject properties are created into titles using the ToString() method.
chart2.Titles.Add("First Series Mean: " + ztestresult.FirstSeriesMean.ToString() +
" | Second Series Mean: " + ztestresult.SecondSeriesMean.ToString());
chart2.Titles.Add("First Series Variance: " + ztestresult.FirstSeriesVariance.ToString() +
" | Second Series Variance: " + ztestresult.SecondSeriesVariance.ToString());
chart2.Titles.Add("Probability Z One Tail: " + ztestresult.ProbabilityZOneTail.ToString());
chart2.Titles.Add("Probability Z Two Tail: " + ztestresult.ProbabilityZTwoTail.ToString());
chart2.Titles.Add("Z Critical Value One Tail: " + ztestresult.ZCriticalValueOneTail.ToString());
chart2.Titles.Add("Z Critical Value Two Tail: " + ztestresult.ZCriticalValueTwoTail.ToString());
chart2.Titles.Add("ZValue: " + ztestresult.ZValue.ToString());
|
 See Also


