


Overview
Bubble charts are a variation of the X-Y chart, where the data points are replaced by bubbles of different size. The second Y value is used to control the size of the bubble. Although the chart is called "bubble" it also can display different shapes, like Square, Diamond, Triangle and Cross. You can specify the plotted shape by using the MarkerStyle property of the series.
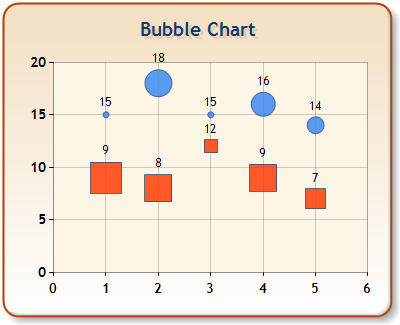
Figure 1: A Bubble chart.
|
Chart Details | |
|---|---|
|
Number of Y values per point: |
2 (second value defines the size of the shape) |
|
Number of series: |
One or more |
|
Support markers: |
Yes |
|
Cannot be combined with: |
Doughnut, Pie, Bar, Stacked Bar charts, Polar, Radar, Pyramid, or Funnel |
|
Custom Attributes |
|---|
|
LabelStyle, BubbleScaleMin, BubbleScaleMax , |
 See Also
Chart Types
Chart Types Overview
Point Chart