


Overview
A point chart uses value points to represent its data.
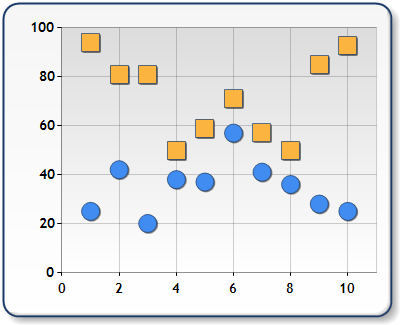
Figure 1: A Point chart.
|
Chart Details |
|
|---|---|
|
Number of Y values per point: |
1 |
|
Number of series: |
One or more |
|
Support markers: |
Yes |
|
Cannot be combined with: |
Doughnut, Pie, Bar, Stacked Bar charts, Polar, Radar, Pyramid, or Funnel |
|
Custom Attributes |
|---|
 See Also
Chart Types
Chart Types Overview
Bubble Chart