


Overview
A step line chart is similar to a line chart, but it does not use the shortest distance to connect two data points. Instead, the step line chart uses vertical, and horizontal lines to connect the data points in a series forming a step-like progression.
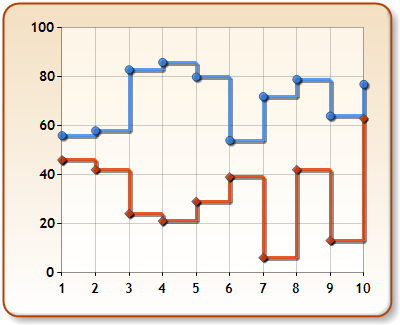
Figure 1: A Step Line chart.
|
Chart Details |
|
|---|---|
|
Number of Y values per point: |
1 |
|
Number of series: |
One or more |
|
Support markers: |
Yes |
|
Cannot be combined with: |
Doughnut, Pie, Bar, Stacked Bar charts, Polar, Radar, Pyramid, or Funnel |
|
Custom Attributes |
|---|