


Overview
The Chaikin Oscillator indicator is the difference between a 3-day exponential moving average, and a 10-day exponential moving average applied to the Accumulation Distribution. Using the Chaikin Oscillator, you can monitor volume flow for a market. The Chaikin Oscillator should be used together with the price envelope.
 Note Note |
|---|
| We recommend that you read Using Financial Formulas before proceeding any further. Using Financial Formulas provides a detailed explanation on how to use formulas, and also explains the various options available to you when applying a formula. |
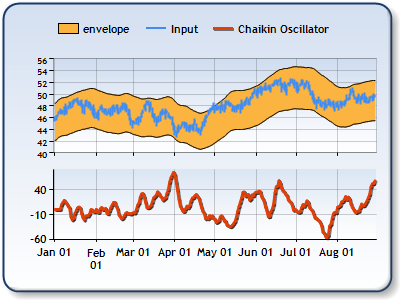 |
| Figure 1: The Chaikin Oscillator indicator in the lower chart area. The high, low, and close prices are plotted in the upper chart area as a stock chart, together with the envelope for the closing price. |
Applying Accumulation Distribution
All formulas are calculated using the FormulaFinancial method, which accepts the following arguments: a formula name; input value(s); output value(s), and parameter(s) that are specific to the type of formula being applied.
Before applying the FormulaFinancial method, make sure that all data points have their XValue property set, and that their series' XValueIndexed property is set to false.
The following table indicates the FormulaFinancial method arguments to use when calculating a the Chaikin Oscillator indicator, and also provides a description for each parameter:
| Parameter |
Value/Description |
Example |
| Formula Name: |
ChaikinOscillator
|
FormulaFinancial(FinancialFormula.ChaikinOscillator, "5,12", _ |
| Input Values: | Value #1: The value that represents the high price. By default it is the first Y value in the stock chart.
Value #2: The value that represents the low price. By default it is the second Y value in the stock chart.
Value #3: The value that is the represents the close price. By default it is the fourth Y value in the stock chart.
Value #4: The value that is the present volume. |
FormulaFinancial(FinancialFormula.ChaikinOscillator, "5,12", _ |
| Output Value: (optional) |
Chaikin Oscillator. If not specified output is stored in the first input value. |
FormulaFinancial(FinancialFormula.ChaikinOscillator, "5,12", _ |
|
Parameter: |
Parameter #1: Short Period for Exponential Moving Average (default=3).
Parameter #2: Long Period for Exponential Moving Average (default=10). |
FormulaFinancial(FinancialFormula.ChaikinOscillator, "5,12", _ |
A line chart is a good choice when displaying a Chaikin Oscillator indicator.
Financial interpretation: The Chaikin Oscillator is based on the premise that if the close price is above the average of the high and close, then there was an accumulation for that day. If the close price is below the average there was a distribution for that day. The rising volume and volume accumulation is a strong signal that prices will go up.
Calculation: The Chaikin Oscillator is the difference between the 3-day exponential moving average and the 10-day exponential moving average applied to the Accumulation Distribution.
![]()
n=1,2,...,m m-Number of periods
CO = EMA3( AD ) - EMA10( AD )
Example
This example demonstrates how to calculate the Chaikin Oscillator. Input Series1 contains High, Low and
Close, Series2 contains volume values.
| Visual Basic |  Copy Code Copy Code |
|---|---|
| |
| C# | Copy Code |
|---|---|
| |