


Overview
The chart area of your chart web part can be automatically or specifically positioned and sized. This lets you set the exact look and proportions of your charting web parts. This article describes how to work with the Chart Area Position property.
Setting The Position Property
The Position property, which includes the Width and Height sizing properties, can be automatically calculated by setting its Auto property to True. When the Auto property is set to True, all of its component settings will be calculated for you by the chart web part. If you choose to set the Position property, or any of its component size properties yourself, you must set the value of the Auto property to False. If any of the Position's component properties are set to a value greater than its default 0 value, then the Auto property will automatically get set to False by the chart web part.
All of the component property settings must be expressed as percentage values. That is to say that you must set the X and Y coordinate positions, as well as the Width and Height properties as a percentage of the entire chart area container.
 Note Note |
|---|
| All settings should be entered as a percentage of the entire chart area container. |
Access The Position Property
Follow these steps to access the Position properties of the chart web part:
- Click on the web part menu, and choose Advanced Properties.
- In the left navigation pane, choose Chart Areas.
- Under the Appearance section, scroll down the list of properties until you find the Position property, and expand this node.
- Under the Position node you can set the X and Y coordinates, the Width and Height properties, as well as the Auto property.
- When you are done setting these properties, click on the Finish button to complete the process.
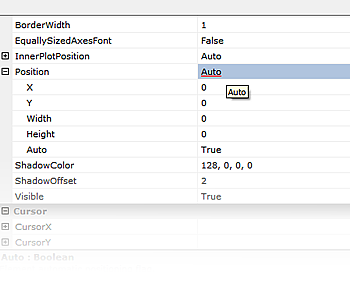
Figure 1: The Position property, and all of its component properties.
 See Also
How To
Working With 3D Charts