


Overview
3D charts are displayed on a chart-area by chart-area basis, and it is possible to display both 2D, and 3D chart areas within the same chart image. 3D charts support all 2D features except for the following:
- Gradient colors.
- Hatching
- Image-related properties (e.g. BackImage).
Summary of Classes Used For 3D Charts
The display of 3D chart areas, as well as their rotation and style are implemented using the ChartArea3DStyle class, which is exposed as the Area3DStyle property of ChartArea objects. The Point3D class is used for the coordinates of 3D points, and the ChartArea class has methods to help transform these 3D points so that they can be used for custom drawing methods. To enable the 3D display of a chart area, set its Enable3D property to True. This can be done at either at design-time, or at run-time.
Rotation and View Angles
The rotation of a chart is determined by the XAngle and YAngle properties, and these properties are measured in degrees. A positive XAngle will rotate the chart counter-clockwise around the horizontal axis, and a positive YAngle will rotate the chart clockwise around the vertical axis. The allowable range for Y angle rotation is -180 to 180 degrees, and -90 to 90 degrees for X angle rotation.
It is important to note that displaying the chart as an isometric projection (accomplished by having the RightAngleAxes property set to True) will result in perceived angles of rotation that may differ from the XAngle and YAngle property values. This occurs because an isometric projection does not display an authentic 3D view.
If your application allows end-users to rotate chart areas using these two properties, then we do not recommend using isometric projections, since the rotation may be unreliable, and not smooth.
Perspective
The amount of perspective in a chart is determined by the Perspective property, and the allowable range is 0-100 percent, the default being zero percent.
Setting Perspective will result in the RightAngleAxes property being set to False (they are mutually exclusive).
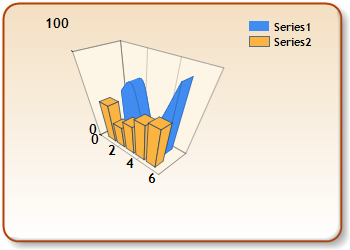
Figure 1: A chart showing perspective.
Isometric Projection
An isometric projection of a chart area is a view where the chart area axes are displayed at right angles to each other.
Isometric projections are displayed by setting the RightAngleAxes property to True, and if set to True the Perspective property will be reset to zero (they are mutually exclusive).
Please note the following points concerning isometric projection:
- it is not "real" 3D (i.e. the angle of rotation around axes doesn't use true rotational angles).
- it is ideal for displaying 3D charts where the developer just wants to show some depth.
- if your application allows end-users to rotate charts then the rotation will not be smooth. In this case we do not recommend using isometric projection.
View Depth
There are two properties that effect the view depth: PointDepth and PointGapDepth. The PointDepth is the depth of data points (e.g. the thickness of an area chart) and is measured as a percentage of the data point width. The PointGapDepth represents the distance between data series that are displayed along different rows (i.e. series with different Z positions), and is measured as a percentage of the distance between data points in one row. See figure 1 below for an illustration of these properties.
Figure 2: PointDepth and PointGapDepth.
Note that all series, regardless of chart types, have depth which may or may not be utilized to draw data points. For example, a column chart series uses it entire depth to draw the columns, while a point chart series does not use its entire depth to draw the points.
Both properties have allowable ranges of 0-1000%.
Clustering
When multiple series for bar or column charts are clustered they are displayed along two distinct rows in a chart area (i.e. each row has a distinct Z position). If the series are not clustered then their corresponding data points (i.e. data points with either the same data point collection index or X values) are then displayed adjacent to each other in one row.
Clustering only applies to bar and column charts, and is controlled by the Clustered property.
Lighting
Lighting is set by the Light property, and can be set to one of three LightStyle enumeration values:
- None - No lighting effects.
- Simplistic - The hue of all chart area elements (e.g. backwall, side walls, etc.) is fixed.
- Realistic - A realistic lighting style is applied, and the hue of all chart area elements (e.g. backwall, side walls, etc.) changes depending on the amount of rotation.
Realistic lighting will affect data points differently, depending on the type of chart being displayed.
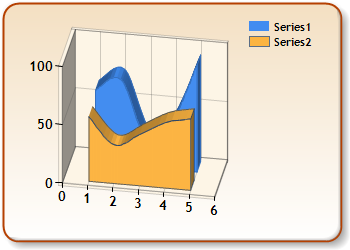
Figure 3: A chart using realistic lighting.
Wall Width
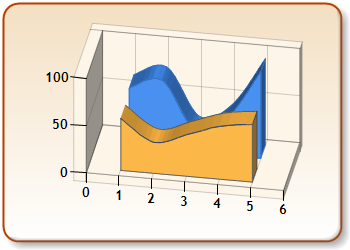
The width of a chart area's walls is set by the WallWidth property. It is measured in pixels, and the allowable range is 0-30 pixels. Using the wall width property, you can give your charts a unique and substantial look. Figure 4 below demonstrates a charts with its wall width property set, as you can see, this chart has a greater presence, and looks more substantial with its thicker walls. The X and Y axes of the chart in Figure 4 are more pronounced since they are displayed against a thicker wall background.
 |
|
Figure 4: A chart with its wall width property set to give it a more substantial overall appearance and presence. |
Marker Lines
Marker lines are vertical and/or horizontal lines that indicate to end-users the exact locations of data points, and the type of marker line displayed depends on the chart type being shown. For example, area charts will have both horizontal and vertical marker lines, while a line chart will only have horizontal lines.
Marker lines are displayed using the ShowMarkerLines custom attribute, which is implemented using the CustomAttributes property.
Markers can be shown for single data points or entire data series, and can be used for the following chart types: all area-type charts, line charts, spline-type charts and range-type charts.
If the BorderColor property of a plotted series is set then the marker lines will use this specified color. If BorderColor is not set then the color of marker lines for the series will automatically be determined by the control, and will be slightly darker than the color of the series.