


Overview
The chart web part has a coordinate system that lets you plot data points on either a 2D or 3D grid. This article discusses the chart's coordinate system, and helps you to familiarize yourself with how data is laid out in the charting web part.
2D Charts
The chart coordinate system has its origin in the upper-left corner of the cartesian grid, with the X axis pointing to the right and the Y axis pointing down as shown in Figure 1 below. The unit of measure is a percentage of the chart picture's width and height, its coordinate values are shown as values between 0 and 100%. By using relative coordinates we make sure that objects remain relative to one another if the chart is resized.
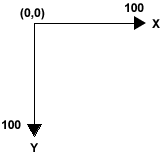
Figure 1: Coordinate system.
There are two chart elements that use this coordinate system, these include:
- The legend which is represented by the Legend object.
- All chart areas which are represented by corresponding ChartArea objects.
The positioning of these objects is accomplished using their Position properties. When setting the position of a plotting area inside of a chart area, a different coordinate system must be employed. The coordinate 0,0 represents the top-left corner of the ChartArea object, and the coordinate 100,100 represents the bottom-right corner of the ChartArea object. This also applies to the Legend object, but only when it is plotted inside of a chart area.
3D Charts
The 3D chart coordinate system is the same as the 2D chart discussed above, with the only difference being the addition of the Z axis coordinates. Like the X and Y axes, the Z axis coordinates are relative, with the backwall of a chart area having a Z value of 0, and the front wall, or screen, of a chart area possessing a Z value of 100.
 See Also
Getting Started
Quick Start