


Remarks
Gets or sets a textual boolean value that indicates the unusual values for the Box chart that will be shown. The attribute will only work if the BoxPlotSeries attribute is set.
| Custom Attribute Summary | |
| Possible Values: | True or False |
| Default Value: | False |
| 2D / 3D Limitations: | No |
| Applies to Chart Element: | Series Objects |
| Applies to Chart Types: | Box Plot |
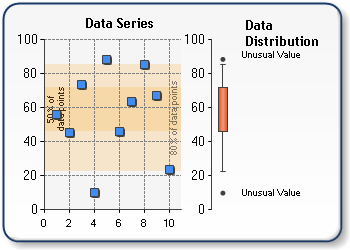
Figure 1: Box chart with BoxPlotShowUnusualValues set to True.
 See Also
Custom Attributes
Custom Attributes Overview
Chart Types
Box Plot Chart