


Overview
The Mass Index is used to predict trend reversal by comparing the difference, and range between High and Low prices. If the Mass Index increases, the range between High and low increases. If the Mass Index decreases, the range between High and Low decreases.
 Note Note |
|---|
| We recommend that you read Using Financial Formulas before proceeding any further. Using Financial Formulas provides a detailed explanation on how to use formulas, and also explains the various options available to you when applying a formula. |
 |
|
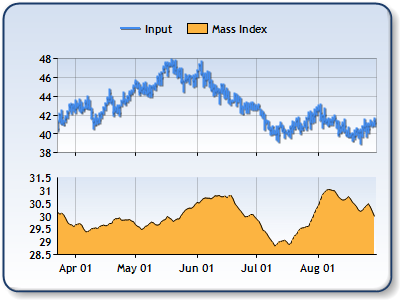
Figure 1: This chart shows the Mass Index in the lower chart area, and the High, Low and Close prices are plotted in the upper chart area as a stock chart. |
Applying a Mass Index Formula
All formulas are calculated using the FormulaFinancial method, which accepts the following types of arguments: a formula name; input value(s); output value(s), and parameter(s) that are specific to the type of formula being applied.
Also, before applying the FormulaFinancial method, make sure that all data points have their XValue property set, and that their series' XValueIndexedproperty has been set to false.
The following table indicates what sort of FormulaFinancial method arguments to use when calculating a Mass index, and also supplies a description of what these parameters mean:
| Parameter |
Value/Description |
Example |
| Formula Name: |
MassIndex
|
FormulaFinancial(FinancialFormula.MassIndex,"30,12","Series1:Y,Series1:Y2","Series3:Y") |
| Input Values: |
Value #1: Value which represents the High price. By default this is the first Y value in the stock chart. Value #2: The value which represents the Low price. By default this is the second Y value in the stock chart. |
FormulaFinancial(FinancialFormula.MassIndex,"30,12","Series1:Y,Series1:Y2","Series3:Y") |
| Output Value: (optional) |
The Mass index. If not specified output is stored in the first input value. |
FormulaFinancial(FinancialFormula.MassIndex,"30,12","Series1:Y,Series1:Y2"," Series3:Y") |
|
Parameters: |
Parameter #1: Period, used to calculate the accumulation (Default value is 25).
Parameter #2: AveragePeriod, used to calculate Simple Moving Average (Default value is 9). |
FormulaFinancial(FinancialFormula.MassIndex,"30,12","Series1:Y,Series1:Y2","Series3:Y") |
A line chart is a good choice when displaying a Mass Index series.
Financial Interpretation: The most significant pattern to watch for is the "reversal bulge", will occur when a 25 day period Mass Index rises above 27 and falls back below 26.5.
If the moving average of prices is going down and a reversal bulge has occurred it is signal for buying. If the moving average of prices is going up and a reversal bulge has occurred it is signal for selling.
Calculation: The Mass Index is calculated using following formula:
![]()
Where EMA is Exponential Moving Average calculated using the AveragePeriod parameter.
Example
This example demonstrates how to calculate Mass Index.
| Visual Basic |  Copy Code Copy Code |
|---|---|
| |
| C# | Copy Code |
|---|---|
| |