


Overview
The On Balance Volume is one of the first volume indicators that measures positive and negative volume flow. Volume is added if the closing price increases, and subtracted if the closing price decreases. On Balance Volume was developed by Joseph Granville.
 Note Note |
|---|
| We recommend that you read Using Financial Formulas before proceeding any further. Using Financial Formulas provides a detailed explanation on how to use formulas, and also explains the various options available to you when applying a formula. |
 |
|
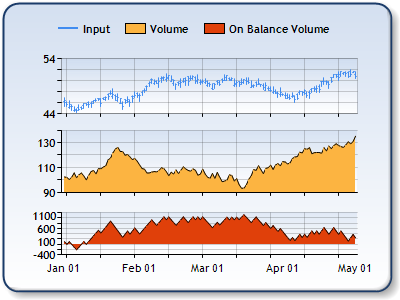
Figure 1: The On Balance Volume in the lower chart area, the Volume in the middle chart area, and the Close price in the upper chart area. |
Applying a On Balance Volume
All formulas are calculated using the FormulaFinancial method, which accepts the following arguments: a formula name; input value(s); output value(s), and parameter(s) that are specific to the type of formula being applied.
Before applying the FormulaFinancial method, make sure that all data points have their XValue property set, and that their series' XValueIndexed property is set to false.
The following table indicates what sort of FormulaFinancial method arguments to use when calculating an On Volume Balance, and also supplies a description of what these parameters mean:
| Parameter |
Value/Description |
Example |
| Formula Name: |
OnBalanceVolume
|
FormulaFinancial(FinancialFormula.OnBalanceVolume,"Series1:Y4,Series2:Y","Series3:Y") |
| Input Values: | Value #1: The value which represents the Close price. In the Dundas chart by default this is the fourth Y value in the stock chart.
Value #2: Value which represents the Volume. |
FormulaFinancial(FinancialFormula.OnBalanceVolume,"Series1:Y4,Series2:Y","Series3:Y") |
| Output Value: (optional) |
On Balance Volume. If not specified output is stored in the first input value. |
FormulaFinancial(FinancialFormula.OnBalanceVolume,"Series1:Y4,Series2:Y"," Series3:Y") |
|
Parameter: |
- |
- |
A line chart is a good choice when displaying an On Balance Volume series.
Financial Interpretation: If the On Balance Volume indicator constantly increases then there is an upwards trend. If the On Balance Volume indicator goes down constantly that means that there is a downwards trend.
If there is a large difference between On Balance Volume and the closing price then there is a market bottom. If there is a small difference between On Balance Volume and the closing price then there is a market top.
Calculation: If Today's close is higher than yesterday's close:
OBV = OBV (yesterday) + Volume (today)
If Today's close is lower than yesterday's close:
OBV = OBV (yesterday) - Volume (today)
If Today's close is equal to the yesterday's close:
OBV = OBV (yesterday)
Example
This example demonstrates how to calculate On Balance Volume.
| Visual Basic |  Copy Code Copy Code |
|---|---|
| |
| C# | Copy Code |
|---|---|
| |