


Overview
The Rate of Change indicator is very similar to the Performance indicator, where the Performance indicator compares the first price with current price while the Rate of Change compares a specified Close price with the current price. This formula is used for both prices and volume.
 Note Note |
|---|
| We recommend that you read Using Financial Formulas before proceeding any further. Using Financial Formulas provides a detailed explanation on how to use formulas, and also explains the various options available to you when applying a formula. |
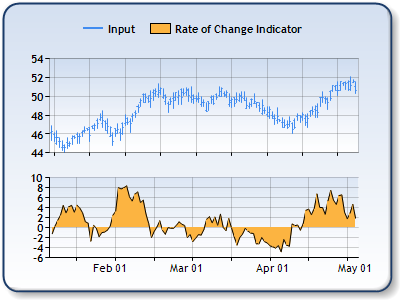 |
| Figure 1: The Rate Of Change indicator of the Close price in the lower chart area. The High, Low and Close prices are plotted in the upper chart area as a stock chart. |
Applying a Rate of Change
All formulas are calculated using the FormulaFinancial method, which accepts the following types of arguments: a formula name; input value(s); output value(s), and parameter(s) that are specific to the type of formula being applied.
Also, before applying the FormulaFinancial method, make sure that all data points have their XValue property set, and that their series' XValueIndexedproperty has been set to false.
The following table indicates what sort of FormulaFinancial method arguments to use when calculating a Rate of Change, and also describes what these parameters mean:
| Parameter |
Value/Description |
Example |
| Formula Name: |
RateOfChange
|
FormulaFinancial(FinancialFormula.RateOfChange,"15","Series1:Y3","Series3:Y") |
| Input Values: |
Value which represents the Close price, Volume or another price. |
FormulaFinancial(FinancialFormula.RateOfChange,"15","Series1:Y3","Series3:Y") |
| Output Value: (optional) |
The Rate of Change. If not specified output is stored in the first input value. |
FormulaFinancial(FinancialFormula.RateOfChange,"15","Series1:Y3"," Series3:Y") |
|
Parameter: |
Period, used to locate a Close Value from the Current Close value. If the period type is day and the Periods parameter is 10 that means that the Current Close value should be compared with the Close value from ten days ago (Default value is 10 periods). |
FormulaFinancial(FinancialFormula.RateOfChange,"15","Series1:Y3","Series3:Y") |
A line chart is a good choice when displaying a Rate of Change series.
Financial Interpretation: The Rate of Change chart shows how much the Close price has changed for a specified period, and shows the differences as percentages. If a performance indicator value is -20 then the Close price has fallen -20%. This indicator can be used for Volume and all prices.
Calculation: The Rate of Change indicator is calculated using following formula:
Example
This example demonstrates how to calculate Rate of Change.
| Visual Basic |  Copy Code Copy Code |
|---|---|
| |
| C# | Copy Code |
|---|---|
| |