


Overview
When a non-default crossing value is used, then by default, an axis's labels and tick marks will move along the axis. This topic discusses crossing points, and demonstrates how to set or alter them.
Setting A Crossing Value At Design-Time
Follow these steps to set a crossing value for an axis at design-time:
- Click on the web part menu dropdown icon, and choose Advanced Properties.
- In the vertical menu under Chart, choose Chart Areas.
- In the Chart Areas dropdown menu, choose any one of the 4 axes to bring up its advanced properties.
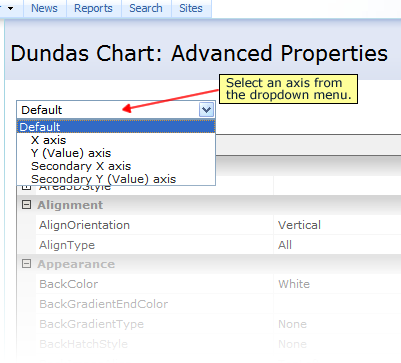
Figure 1: Choose an axis from the Chart Areas dropdown menu.
- In the advanced properties area, scroll down to the Scale category, and expand it if it is collapsed.
- Under the Scale category you will find the Crossing property whose default setting is Auto. Insert your new numerical data value here. This property will accept any numerical value (as a Double data type) including decimal number values.
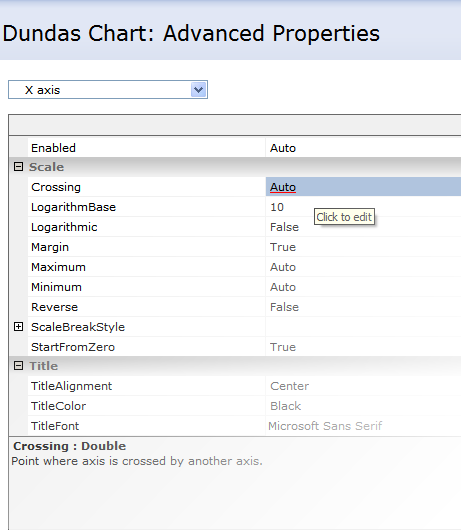
Figure 2: Set the Crossing property value.
- Click the Finish button, which is found at the far bottom right of the screen, to complete the process.
Crossing Property Settings
The Crossing property can be set to Auto, or it can be set to any valid numerical or decimal value. When set to Auto mode, the crossing value will be automatically set to the relevant axis's minimum or maximum value. If the axis is a primary axis, then the value set in this mode will be its minimum value. However, if the axis is a secondary axis, then the value set while in this mode will be its maximum value.
Scale Property Settings That Affect Crossing
The Scale property lets you set the following modes or values which will affect the behavior of the Crossing property:
-
Minimum mode, which means that the axis's crossing value will also be its minimum value.
-
Maximum mode, which means that the axis's crossing value will also be its maximum value.
-
If you choose to use a specified double value, then this value must be between the relevant axis's Minimum and Maximum value. An example of this is illustrated in Figure 2 below. If for any reason the crossing value is less than the minimum value, or greater than maximum value, then an exception will be thrown.
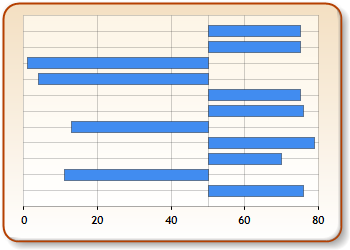
Figure 3: A chart demonstrating data with the Crossing property set to 50.
Axis Labels Tick Marks and Crossing Points
The labels and tick marks of an axis will, by default, move along the axis if the crossing value is set to a non-default value. This behavior can be changed by setting the MarksNextToAxis property to False. When this property is set to False, the axis labels and tick marks will stay fixed within the ChartArea object.
 See Also
How To
Using Axis Types