


Overview

The Average True Range is an indicator that measures commitment, and compares the range between the High, Low and Close prices. This indicator was developed by J. Welles Wilder.
 Note Note |
|---|
| We recommend that you read Using Financial Formulas before proceeding any further. Using Financial Formulas provides a detailed explanation on how to use formulas, and also explains the various options available to you when applying a formula. |
 |
|
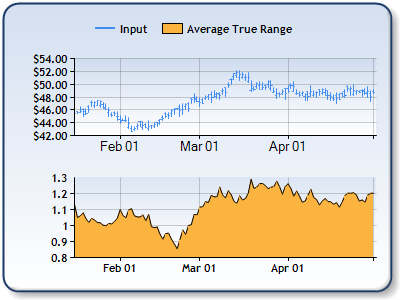
Figure 1: The Average True Range in the lower chart area, and the High, Low, and Close prices in the upper chart area as a stock chart. |
Applying Average True Range
The following table lists the parameters used in the FormulaFinancial method to calculate an Average True Range, and also supplies a description of what these parameters mean:
| Parameter |
Value/Description |
Example |
| Formula Name: |
AverageTrueRange
|
FormulaFinancial(FinancialFormula.AverageTrueRange,"15",_ "Series1:Y,Series1:Y2,Series1:Y4","Series3:Y") |
| Input Values: |
Value #1: The value which represents the High price (by default this is the first Y value in the stock chart). |
FormulaFinancial(FinancialFormula.AverageTrueRange,"15", _ "Series1:Y,Series1:Y2,Series1:Y4","Series3:Y") |
| Output Value: (optional) |
The Average True Range. If not specified output is stored in the first input value. |
FormulaFinancial(FinancialFormula.AverageTrueRange,"15", _ "Series1:Y,Series1:Y2,Series1:Y4","Series3:Y") |
|
Parameter: (optional) |
Period, used to calculate the Average True Range (Default value is 14). |
FormulaFinancial(FinancialFormula.AverageTrueRange,"15", _ |
A line chart is a good choice when displaying an Average True Range series.
Financial Interpretation: High Average True Range values often occur at market bottoms due to extensive panic sell. Low Average true range values are characteristic with market tops.
Calculation: To find the Average True Range it is first necessary to find the True Range. Finding the True range is done in this manner:
True Range = MAX( |High(today) - Low(today)|, |Close(yesterday) - High(today)|, |Close(yesterday) - Low(today)|)
The Average True range is calculated as a Simple Moving Average of True Range.
Example
This example demonstrates how to calculate the Average True Range.
| Visual Basic |  Copy Code Copy Code |
|---|---|
| |
| C# | Copy Code |
|---|---|
| |
 See Also
Financial Formulas
Formulas Overview
Using Financial Formulas