


Overview

Dundas Chart for Windows Forms comes with enhanced formula support for use in financial applications. There are 32 Technical Analyses formulas including Different Moving Averages, Price Indicators, Volume Indicators, Oscillators, and others. In addition to this, there are also Time Series and Forecasting formulas.
Technical Analyses is rooted in Charles Dow theory. Dow created the Industrial Average and Transport Average, and believed that the behavior of the averages reflected the hopes and fears of the entire market. This theory is based on the hypothesis that prices have a trending nature.
Time Series and Forecasting formulas are used to identify the nature of the sequence of observations, and to predicting future values using historical observations (forecasting). In time series analysis, it is assumed that the data consist of a systematic pattern and random noise that usually makes the pattern difficult to identify.
 Note Note |
|---|
| There is a complete listing of all Chart formulas, along with a brief description of each, at the conclusion of this topic. Also, each formula has its own help topic located in the "Formula Reference" folder of this documentation. |
The most common chart types used in Technical analyses are: Stock Charts (High, Low, Open Close); Column Charts (Volume); Line Charts (Different Technical Indicators) and the Range Chart (Bollinger Bands, Deviation Chart, etc.).
Applying a Formula an Overview
To apply a formula perform the following:
-
Determine if the data must first be filtered and/or grouped, and then perform the necessary filtering/grouping if required.
-
For averaging formulas only, set the DataManipulator object's StartFromFirst property to the desired value (or use the default).
-
Use the FormulaFinancial method of the DataManipulator class to apply the formula. Note: all formulas have specific requirements (e.g. required input, etc.), and each formula is implemented differently (e.g. default values, etc.). For a general discussion of formula-specific requirements see the section further down. For a detailed explanation of a particular formula, and it's requirements see the Formula Reference folder.
Applying a Formula - Individual Steps
1. Grouping, Filtering and Formulas
In some cases data will have to be manipulated (i.e. filtered and/or grouped) before using a formula.
For example, let's assume that there is raw Stock data with different prices for each day for the last 4 months. The goal is to find a William's %R indicator for this data. We assume the raw stock data and noise are represented by a point chart, and that they were added at design-time. Further, we assume that the DundasBlue template has been applied to the original chart for appearance purposes.
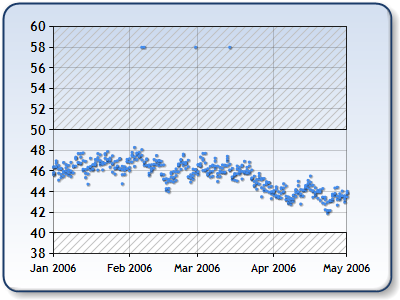
Figure 1: Raw data.
The first step is to remove 'noise' from the data and to filter all Y values below 40 and above 50. This step is important if we want to remove all anomalous data that incorrectly influences the trend.
To do this we will use the Filter method of the DataManipulator class as shown:
| Visual Basic |  Copy Code Copy Code |
|---|---|
| |
| C# | Copy Code |
|---|---|
| |

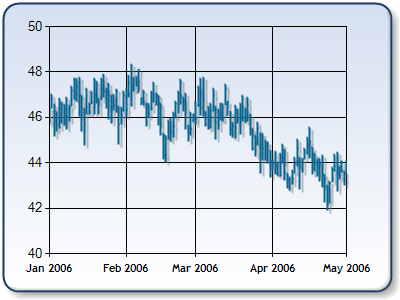
Figure 2: The Raw data with 'noise' eliminated.
The next step is to create a stock chart with Hi, Low, Open and Close prices. First the data must be grouped so that we have the largest, smallest, opening and closing values for each date.
This is done using the Group method of the DataManipulator class as shown:
| Visual Basic | Copy Code |
|---|---|
| |
| C# | Copy Code |
|---|---|
| |
The following chart image was created when the code above was used; 'Series1' refers to the original raw filtered data, and 'Series2' refers to the the new stock type series created.
 |
| Figure 2: Filtered and grouped stock chart that displays High, Low, Open, and Close values. |
Now we are ready to use the FormulaFinancial method to calculate the William's %R formula as shown:
| Visual Basic | Copy Code |
|---|---|
| |
| C# | Copy Code |
|---|---|
| |

Figure 3: Williams %R formula Chart.
Notice that the Williams %R formula doesn't start at the same position where the stock chart starts (Figure 2). This is because the Williams %R formula uses a default period of 14 historical data points, and as a result the first 14 data points from the stock chart will be used to calculate the Williams %R formula. These first 14 data points are not displayed on the chart which presents Williams %R output data.
2. StartFromFirst Property (only applies to averaging formulas)
Since averages of a specified period cannot be calculated for the first number of n data points, where n is the "Period", this property determines how these first data points are dealt with.
Let's assume that we are using a moving average period of 20 days. If StartFromFirst is False (the default), the first 20 data points are just ignored and the moving average will start after 20 days using the previous 20 periods (data points) as historical data only. If StartFromFirst is True, the first 20 data points will be calculated as the n period moving average, where n is current index of data points. (e.g. the third data point will have a value which is equal to the 3 days moving average, while all data points after 20th data point will have 20 days moving average).
3. FormulaFinancial Method
All financial formulas are calculated using the FormulaFinancialmethod, which accepts the following types of arguments: a formula name; input value(s); output value(s), and parameter(s) that are specific to the type of formula being applied.
This method has up to four parameters:
-
Formula Name: A FinancialFormula enumeration value that specifies the formula name. This parameter is not optional.
Examples:
- FinancialFormula.RateOfChange
- FinancialFormula.WeightedMovingAverage
-
Input Values: String or Series object(s) which is/are used to specify input Y values and series (this parameter is not optional).
If the string type is used, input values could be used from different data series and different Y values. If there is more than one input value, then the values should be comma separated. Multiple input values can be used only if the string parameter type is used, and the Series name and Y value index is separated with a semicolon (:). If the Y value is not specified then the first Y value will be used for the formula (the series name must always be specified, however).
Examples:
- "Series1:Y" - The first Y value is used from series 'Series1'.
- "Series1:Y,Series4" - The first Y values are used from series 'Series1' and 'Series4'.
- "Series1:Y,Series2:Y2" - The first Y value is used from series 'Series1'. The Second Y value is used from series 'Series2'.
- "Series1:Y,Series2:Y2,Series2:Y3" - The first Y value is used from series 'Series1'. The Second Y value is used from series 'Series2'. The Third Y value is used from series 'Series2'.
If a Series object is used for the input value then the first Y value of the series' data points will be used by the formula. -
Output Values (optional): String or Series object(s) which is/are used to specify output Y values and series.
Output Values are used the same way as Input Values, the only difference being that output values are optional.
If output values are not specified then the input values will be used to store the formula data, with the first output value stored in the first listed input value, etc. If the number of input values is less than the number of output values an exception will be thrown.
If an output series is specified as a Series object, and the series has not been created and added to the SeriesCollection when the function call is made an exception will be thrown. However, if the series has not been created and added to the SeriesCollection BUT has been specified as a string expression then it will automatically be created at run-time, and have default Series properties (e.g. column chart type, etc.). In addition, the ChartArea property of this series is set to "Default", and if a chart area with the name "Default" exists in the ChartAreasCollection it will be used to draw the chart. If there is no chart area with this name the first ChartArea object in the collection will be used to display the series. -
Parameters: String expression that is used for various formula-dependent parameters. Mostly parameters are used to specify a "period", which is a time period used to calculate a moving average. If a formula needs more than one input parameters (e.g. a short and long period), they should be comma-separated. Some parameters can be omitted and some cannot, depending on the formula type. If a parameter is missing and is not optional an exception will be thrown.
Examples:
- "10,20" - Short and long period for Chaikin Oscillator formula.
- "2,40,true,true" - Polynomial degree, forecasting period, and two booleans that determine if approximation errors and forecasting errors (respectively) are returned.
 Caution
Many formulas which used a period, use historical data with more data points than the period property. If there are not enough historical data points an exception will be thrown.
Some formulas, especially those that use historical data, will result in output series that have fewer data points compared to the input series (e.g. a 20-day Moving average will not have data points for the fist 20 days). If the same chart area is used to display both input and output series then it may be desirable to filter out all historical data points (data points without corresponding output points) from the input series, after applying the formula method.
Formula-Specific Requirements
The majority of technical analyses formulas use stock prices for calculations. Some of them use Hi, Low and Close values while others use some sort of different prices or values (e.g. volume, etc.). Note: unlike stock charts, which use predetermined Y values (High - Y, Low - Y2, Open - Y3 and Close - Y4), Technical Analyses formulas must always have their Y values explicitly set.
Example
This example demonstrates how to use a formula to calculate Typical price.
| Visual Basic | Copy Code |
|---|---|
| |
| C# | Copy Code |
|---|---|
| |
As mentioned before, some formulas (Moving Averages) use the StartFromFirst property from DataManipulator class. Some formulas also use default values for parameters, and still others throw an exception if a value is not supplied.
| Note |
|---|
| For more information on how to use a specific formula, refer to that formula's topic in the Formulas folder. |
Formula Listing With Links to Formula Topics
|
Formula Name |
Description |
| Accumulation Distribution | The accumulation distribution formula is an improved On Balance Volume indicator. This indicator uses a relationship between volume and prices to estimate the strength of price movements. If volume is increased, there is a high probability that prices will move up. |
| Average True Range | Average True Range is an indicator that measures commitment comparing the range between High, Low and Close prices. This indicator is developed by J. Welles Wilder. |
| Bollinger Bands | Bollinger Bands are an indicator that are plotted at standard deviation levels above and below a simple moving average. Since standard deviation is a measure of volatility, a large standard deviation is a good indicator for a volatile market, while a smaller standard deviation is an indicator of a calmer market.
Bollinger Bands are a good way to compare volatility and relative price levels over a period of time. |
| Chaikin Oscillator | The Chaikin Oscillator indicator is the difference between a 3-day exponential moving average and a 10-day exponential moving average applied to Accumulation Distribution. Using the Chaikin Oscillator, it is possible to monitor volume flow on the market. The Chaikin Oscillator should be used together with the price envelope. |
| Commodity Channel Index | The Commodity Channel Index compares Prices with its moving averages. If the Commodity channel index is high it means that price are higher than its moving average which is indicator that security is overbought. If the Commodity channel index is low it means that price are lower than its moving average which is indicator that security is oversold. |
| Detrended Price Oscillator | The Detrended Price Oscillator is used to "remove" trend from the price. Comparing Closing or any other price with it's moving average Detrende Price Oscillator eliminates cycles longer than moving average. |
| Ease of Movement | Ease of Movement deals with relationship between volume and price changes. This indicator uses volume to estimate how strong is trend of prices. Ease of Movement was developed by Richard W Arms. |
| Envelopes | The envelopes are plotted above and below a moving average using specified percentage. Envelopes indicator is used to create signals for buying and selling. The percentage which will be used for calculating envelopes is specified by user and it depends on volatility of the market. If the market is more volatile the percentage is higher. |
| Exponential Moving Average | A Exponential Moving Average is an average of data calculated over a period of time where the most recent days have more weight. The exponential moving average can be used with any price: Hi, Low, Open, Close or it could be applied to other indicators. Exponential Moving average smooth a data series which is very important in volatile market.
Dundas Chart for Windows Forms has four types of moving averages: Simple, Exponential, Triangular, and Weighted. The most important difference between the various moving averages is how weights are applied. |
| Time Series and Forecasting | The Time Series analysis has two main goals: Identifying the nature of the sequence of observations and Predicting future values using historical observations (forecasting). |
| MACD | The MACD indicator compares two moving averages of prices. The MACD is used with its 9 day Exponential Moving average as signal. This signals indicate buying and selling moments. This indicator is developed by Gerald Appel. |
| Mass Index Formula | The Mass index is developed to predict trend reversal by comparing difference and range between High and Low prices. If the Mass index going up, the range between High and low is bigger. If the Mass index going down, the range between High and Low is smaller. |
| Median Price | Median price is mid-point value of daily prices. Median price could be used as a filter for trend indicators. It is also used as daily average price which is very useful if we want more simple view of prices. |
| Money Flow | The money flow indicator compare upward changes and downward changes of the volume weighted typical prices. This indicator is similar to relative strength index. The difference is in the volume weighted prices. This indicator could be used to identify market tops and bottoms. |
| Negative Volume Index | The Negative Volume Index should be used together with Positive Volume index. The negative volume index is changed only if the volume decreases from the previous day. |
| On Balance Volume | The On Balance Volume is one of the first volume indicators which measure positive and negative volume flow. Volume is added if closing price moves up and subtracted if closing price moves down. The On Balance Volume is developed by Joseph Granville. |
| Performance | The Performance indicator compares u current Close (or any other price) with the first Close value ( Close value from the first time period ). This indicator shows how much Close price was changed from the beginning. |
| Positive Volume Index | The Positive Volume Index should be used together with Negative Volume index. The Positive volume index is changed only if the volume decreases from the previous day. |
| Price Volume Trend | The Price Volume Trend is cumulative volume total which is calculated using relative changes of the Close price. The Price Volume trend is mostly used with other indicators. |
| Rate Of Change | Rate of Change indicator is very close to Performance indicator. Performance indicator compares the first price with current price and Rate of Change compares specified Close price with current price. This formula is used for prices and volume. |
| Relative Strength Index | The Relative Strength Index is momentum oscillator which compares a upward movements of Close price with downward movements resulting a value which range is between 0 and 100. The Relative Strength index is developed by J. Welles Wilder. |
| Simple Moving Average | A Simple Moving Average is an average of data calculated over a period of time. The moving average is the most popular price indicator used in technical analyses, and can be used with any price: Hi, Low, Open, Close or it could be applied to other indicators. Moving average smooth a data series which is very important in volatile market. With a moving average is much easier to spot a trend. |
| Standard Deviation | Standard deviation is used to indicate volatility. It measures difference between values (Closing Price) and average. If the difference is larger, the standard deviation and volatility are higher. If the value (Closing price) is closer to the average price, the standard deviation and volatility are lower. |
| Stochastic Indicator | When a trend is upward, there is a tendency that close price will be very close to that day's high. During a downward trending market there is a tendency that close price is close to low price. The Stochastic Indicator helps to find trend reversal searching for a period when close prices is close to low price in up trending market or close prices is close to high price in down trending market. This formula has two output values: %K - Simple Stochastic Indicator and %D - Smoothed Stochastic Indicator (Moving Average of %K). |
| Triangular Moving Average | A Triangular Moving Average is an average of data calculated over a period of time where the middle portion of data have more weight. The Triangular Moving Average can be used with any price: Hi, Low, Open, Close or it could be applied to other indicators. Triangular Moving Average smooth a data series which is very important in volatile market. |
| TRIX | The TRIX is based on triple moving average of Closing Price and his purpose is to eliminate shorter cycles. This indicator keeps Close price in trends that are shorter than specified period. |
| Typical Price | Typical price is average value of daily prices. Typical price could be used as a filter for trend indicators. It is also used as daily average price which is very useful if we want more simple view of prices. |
| Volatility Chaikins | The Volatility Chaikins indicator measure difference between High and Low prices. This formula is used to indicate top or bottom of the market. This formula is developed by Marc Chaikin. |
| Volume Oscillator | The Volume oscillator try to identify trends in volume comparing two moving averages; one with short period and second with longer period. |
| Weighted Close | Weighted Close formula calculates average value of daily prices. The only difference between Typical Price and Weighted Close is that closing price has extra weight as most important price. Weighted Close could be used as a filter for trend indicators. It is also used as daily average price which is very useful if we want more simple view of prices. |
| Weighted Moving Average | A Weighted Moving Average is an average of data calculated over a period of time where the greater weights are attached to the most recent data. The weighting is calculated from the sum of days. The Weighted Moving Average can be used with any price: Hi, Low, Open, Close or it could be applied to other indicators. Weighted Moving Average smooth a data series which is very important in volatile market. |
| William's %R | William's %R is a momentum indicator. This indicator is used to measure overbought and oversold levels. This indicator is very similar to Stochastic %K indicator, except that Williams %R is always negative value between 0 and -100. This indicator is developed by Larry Williams. |
 See Also
How To
Financial Markers
Statistical Formulas
Using Statistical Formulas