


Overview

The Volatility Chaikins indicator measures the difference between High and Low prices, and is used to indicate tops or bottoms of the market. This formula was developed by Marc Chaikin.
 Note Note |
|---|
| We recommend that you read Using Financial Formulas before proceeding any further. Using Financial Formulas provides a detailed explanation on how to use formulas, and also explains the various options available to you when applying a formula. |
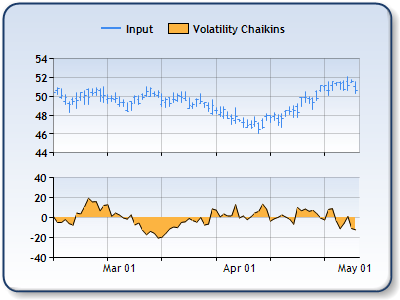 |
| Figure 1: The Volatility Chaikins in the lower chart area, and the High, Low and Close prices in the upper chart area as a stock chart. |
Applying Volatility Chaikins
All financial formulas are calculated using the FormulaFinancialmethod, which accepts the following types of arguments: a formula name; input value(s); output value(s), and parameter(s) that are specific to the type of formula being applied.
Also, before applying the FormulaFinancial method, make sure that all data points have their XValue property set, and that their series' XValueIndexedproperty has been set to false.
The following table indicates what sort of FormulaFinancial method arguments to use when calculating a Volatility Chaikins, and also supplies a description of what these parameters mean:
| Parameter |
Value/Description |
Example |
| Formula Name: |
VolatilityChaikins
|
FormulaFinancial(FinancialFormula.VolatilityChaikins,"15,15", _ |
| Input Values: |
Value #1: Value which represents the High price. By default this is the first Y value in the stock chart. |
FormulaFinancial(FinancialFormula.VolatilityChaikins,"15,15", _ |
| Output Value: (optional) |
The Volatility Chaikins indicator. If not specified output is stored in the first input value. |
FormulaFinancial(FinancialFormula.VolatilityChaikins,"15,15", _ |
|
Parameters: |
Parameter #1: Period used to determine how many days should be shifted between Exponential Moving averages. (Default value is 10).
Parameter #2: Moving Average Period, used to calculate the Exponential Moving Average of high - low price difference. (Default value is 10). |
FormulaFinancial(FinancialFormula.VolatilityChaikins,"15,15", _ |
A line chart is a good choice when displaying a Volatility Chaikins series.
Financial Interpretation: If the volatility (the difference between High and Low prices) is high it could indicate a market top (high market activity). If the volatility is low it could indicate a market bottom (low market activity).
Calculation: Volatility Chaikins is calculated using the following formulas:
![]()
![]()
Example
This example demonstrates how to calculate Volatility Chaikins.
| Visual Basic |  Copy Code Copy Code |
|---|---|
| |
| C# | Copy Code |
|---|---|
| |
 See Also
Financial Formulas
Formulas Overview
Using Financial Formulas