


Overview

The Performance indicator compares a current Close (or any other price) with the first Close value (from the first time period ). This indicator shows the degree of a change in a price.
 Note Note |
|---|
| We recommend that you read Using Financial Formulas before proceeding any further. Using Financial Formulas provides a detailed explanation on how to use formulas, and also explains the various options available to you when applying a formula. |
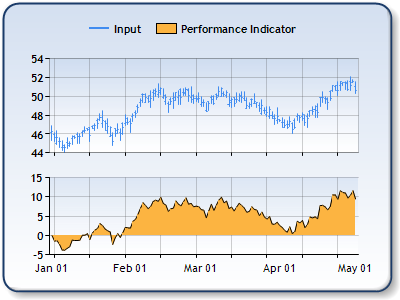 |
| Figure 1: This chart shows the Performance indicator of the Close price in the lower chart area. The High, Low and Close prices are plotted in the upper chart area as a stock chart. |
Applying a Performance
All formulas are calculated using the FormulaFinancial method, which accepts the following types of arguments: a formula name; input value(s); output value(s), and parameter(s) that are specific to the type of formula being applied.
Also, before applying the FormulaFinancial method, make sure that all data points have their XValue property set, and that their series' XValueIndexedproperty has been set to false.
The following table indicates what sort of FormulaFinancial method arguments to use when calculating a Performance, and also supplies a description of what these parameters mean:
| Parameter |
Value/Description |
Example |
| Formula Name: |
Performance |
FormulaFinancial(FinancialFormula.Performance,"Series1:Y4","Series3:Y") |
| Input Value: | Value which represents a price (by default a stock chart's values are High, Low, Open and Close, respectively). |
FormulaFinancial(FinancialFormula.Performance,"Series1:Y4","Series3:Y") |
| Output Value: (optional) |
The Performance. If not specified output is stored using the input value. |
FormulaFinancial(FinancialFormula.Performance,"Series1:Y4","Series3:Y") |
|
Parameter: |
- |
- |
A line chart is a good choice when displaying a Performance formula series.
Financial Interpretation: The performance chart shows how much a Close price (or any other price) changes from the price in the first period. This indicators shows the difference as a percentage (e.g. if a performance indicator value is -20 then the Close price has fallen -20%).
Calculation: The Performance indicator is calculated using following formula:
![]()
Example
This example demonstrates how to calculate Performance.
| Visual Basic |  Copy Code Copy Code |
|---|---|
| |
| C# | Copy Code |
|---|---|
| |
 See Also
Financial Formulas
Formulas Overview
Using Financial Formulas