


Overview

The accumulation distribution formula is an improved On Balance Volume indicator. This indicator uses a relationship between volume and prices to estimate the strength of price movements, and if volume is increased there is a high probability that prices will go up.
 Note Note |
|---|
| We recommend that you read Using Financial Formulas before proceeding any further. Using Financial Formulas provides a detailed explanation on how to use formulas, and also explains the various options available to you when applying a formula. |
 |
|
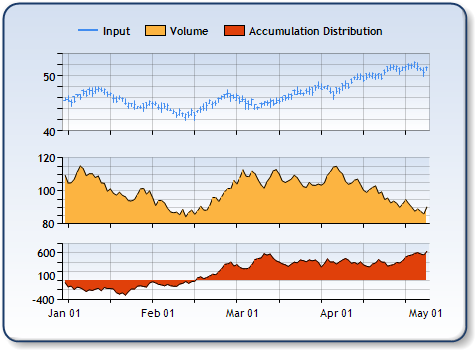
Figure 1: Accumulation distribution in the bottom chart area with the volume in the middle chart area. The high, low, and close prices are plotted in the upper chart area as a stock chart. |
Applying the Accumulation Distribution Formula
All formulas are calculated using the FormulaFinancial method, which accepts the following arguments: a formula name; input value(s); output value(s), and parameter(s) that are specific to the type of formula being applied.
Before applying the FormulaFinancial method, make sure that all data points have their XValue property set, and that their series' XValueIndexed property is set to false.
The following table indicates the FormulaFinancial method arguments to use when calculating an accumulation distribution, and also provides a description for each parameter.
| Parameter |
Value/Description |
Example |
| Formula Name: |
AccumulationDistribution
|
FormulaFinancial(FinancialFormula.AccumulationDistribution, _ "Series1:Y,Series1:Y2,Series1:Y4,Series2:Y","Series3:Y") |
| Input Values: |
Value #1: The value that represents the high price. By default, it is the first Y value in the stock chart. |
FormulaFinancial(FinancialFormula.AccumulationDistribution, _ "Series1:Y,Series1:Y2,Series1:Y4,Series2:Y","Series3:Y") |
| Output Value: (optional) |
Accumulation Distribution. If not specified output is stored in the first input value. |
FormulaFinancial(FinancialFormula.AccumulationDistribution, _ "Series1:Y,Series1:Y2,Series1:Y4,Series2:Y","Series3:Y") |
|
Parameter: |
- |
- |
A line chart is a good choice for displaying an Accumulation Distribution series.
Financial Interpretation: When the accumulation distribution is increasing then the price will probably increase since the security is being accumulated. If the accumulation distribution is decreasing then the price will probably go down since the security is being distributed.
The bullish divergence between the accumulation distribution and the prices means that in the near future prices will likely increase. The bearish divergence between the accumulation distribution and prices means that in the near future prices will probably go down.
Calculation: The Accumulation Distribution Index is calculated as a cumulative total of prices and volumes.
![]()
n=1,2,...,m m-Number of periods.
Example
This example demonstrates how to calculate the accumulation distribution. This code calculates the accumulation distribution. Input Series1 contains High, Low, and Close values. Series2 contains the volume values.
| Visual Basic |  Copy Code Copy Code |
|---|---|
| |
| C# | Copy Code |
|---|---|
| |
 See Also
Financial Formulas
Formulas Overview
Using Financial Formulas