


Overview

Standard Deviation is used to indicate volatility, and measures the difference between values, like closing price, and their moving average. The larger the difference, the higher the Standard Deviation and volatility. The smaller the difference, the lower the Standard Deviation and volatility.
 Note Note |
|---|
| We recommend that you read Using Financial Formulas before proceeding any further. Using Financial Formulas provides a detailed explanation on how to use formulas, and also explains the various options available to you when applying a formula. |
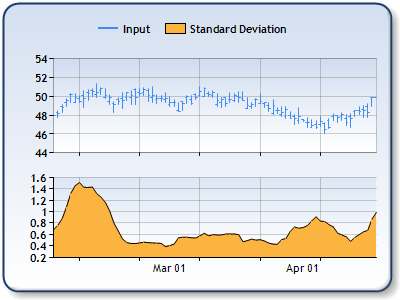 |
| Figure 1: The Standard deviation of the Close price in the lower chart area. The High, Low and Close prices are plotted in the upper chart area as a stock chart. |
Applying a Standard Deviation Formula
All formulas are calculated using the FormulaFinancial method, which accepts the following types of arguments: a formula name; input value(s); output value(s), and parameter(s) that are specific to the type of formula being applied.
Also, before applying the FormulaFinancial method, make sure that all data points have their XValue property set, and that their series' XValueIndexedproperty has been set to false.
The following table indicates what sort of FormulaFinancial method arguments to use when calculating a Standard deviation, and also supplies a description of what these parameters mean:
| Parameter |
Value/Description |
Example |
| Formula Name: |
StandardDeviation
|
FormulaFinancial(FinancialFormula.StandardDeviation,"15","Series1:Y4","Series3:Y") |
| Input Value: | Value which represents the Close price. By default it is the fourth Y value in the stock chart. |
FormulaFinancial(FinancialFormula.StandardDeviation,"15","Series1:Y4","Series3:Y") |
| Output Value: (optional) |
The Standard deviation. If not specified output is stored in the input value. |
FormulaFinancial(FinancialFormula.StandardDeviation","15","Series1:Y4"," Series3:Y") |
|
Parameter: |
Periods property, used to determine a time period which is used in the Standard deviation. |
FormulaFinancial(FinancialFormula.StandardDeviation","15","Series1:Y4","Series3:Y") |
A line chart is a good choice when displaying a Standard Deviation series.
Financial Interpretation: When the close price is stable the Standard Deviation is low, but if the close price changes dramatically, then there will be a high Standard Deviation present. Market tops are usually accompanied by a high Standard Deviation, which indicates volatility. Market bottoms are usually accompanied by a low Standard Deviation.
Calculation: The Standard deviation is calculated using following formula:

SMA - Simple Moving Average
n - Number of Time Periods
Example
This example demonstrates how to calculate Standard deviation.
| Visual Basic |  Copy Code Copy Code |
|---|---|
| |
| C# | Copy Code |
|---|---|
| |
 See Also
Financial Formulas
Formulas Overview
Using Financial Formulas