


Overview

The MACD (Moving Average Convergence/Divergence) indicator compares the two moving averages of prices. The MACD is used with a 9-day Exponential Moving average as a signal that indentifies buying or selling moments. This indicator was developed by Gerald Appel.
 Note Note |
|---|
| We recommend that you read Using Financial Formulas before proceeding any further. Using Financial Formulas provides a detailed explanation on how to use formulas, and also explains the various options available to you when applying a formula. |
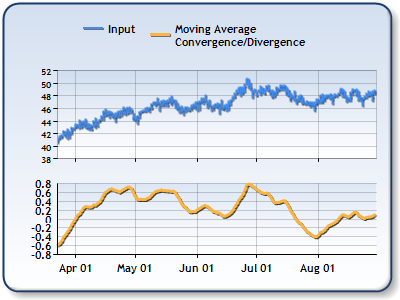 |
| Figure 1: An MACD indicator in the lower chart area. The High, Low and Close prices are plotted in the upper chart area as a stock chart. |
Applying a MACD Formula
All formulas are calculated using the FormulaFinancial method, which accepts the following arguments: a formula name; input value(s); output value(s), and parameter(s) that are specific to the type of formula being applied.
Before applying the FormulaFinancial method, make sure that all data points have their XValue property set, and that their series' XValueIndexed property is set to false.
The following table indicates what sort of FormulaFinancial method arguments to use when calculating a MACD, and also supplies a description of what these parameters mean:
| Parameter |
Value/Description |
Example |
| Formula Name: |
MACD
|
FormulaFinancial(FinancialFormula.MACD,"15,30","Series1:Y3","Series3:Y") |
| Input Values: | Value which represents a price. |
FormulaFinancial(FinancialFormula.MACD,"15,30","Series1:Y3","Series3:Y") |
| Output Value: (optional) |
The MACD indicator. If not specified output is stored in the input value. |
FormulaFinancial(FinancialFormula.MACD,"15,30","Series1:Y3"," Series3:Y") |
|
Parameters: |
Parameter #1: ShortPeriods property, used to determine a Short Exponential Moving Average time period which is used in the MACD formula (Default value is 12).
Parameter #2: LongPeriods property, used to determine a Long Exponential Moving Average time period which is used in the MACD formula (Default value is 26). |
FormulaFinancial(FinancialFormula.MACD,"15,30","Series1:Y3","Series3:Y") |
A line chart is a good choice when displaying a MACD series.
Financial Interpretation: The MACD indicator should be used with a 9-day Exponential Moving Average as its Signal Line. The time to sell is when the MACD indicator falls below its signal line. Similarly, the time to buy is when the MACD indicator is higher than its signal line.
When the MACD rises it means that security could be overbought. When the MACD diverges from prices this could be a sign that the current trend is close to being finished.
Calculation: The MACD is calculated as a distance between a Short and a Long Exponential Moving Average.
Samples:
This example demonstrates how to calculate the MACD.
| Visual Basic |  Copy Code Copy Code |
|---|---|
| |
| C# | Copy Code |
|---|---|
| |
 See Also
Financial Formulas
Formulas Overview
Using Financial Formulas