


Overview

The TRIX indicator formula is based on a triple moving average of the closing price. Its purpose is to eliminate short cycles. This indicator keeps the closing price in trends that are shorter than the specified period.
 Note Note |
|---|
| We recommend that you read Using Financial Formulas before proceeding any further. Using Financial Formulas provides a detailed explanation on how to use formulas, and also explains the various options available to you when applying a formula. |
 |
|
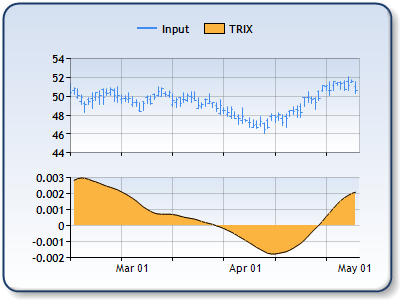
Figure 1: The TRIX indicator in the lower chart area. The High, Low and Close prices are plotted in the upper chart area as a stock chart. |
Applying a TRIX Formula
All financial formulas are calculated using the FormulaFinancialmethod, which accepts the following types of arguments: a formula name; input value(s); output value(s), and parameter(s) that are specific to the type of formula being applied.
Also, before applying the FormulaFinancial method, make sure that all data points have their XValue property set, and that their series' XValueIndexedproperty has been set to false.
The following table indicates what sort of FormulaFinancial method arguments to use when calculating a TRIX, and also supplies a description of what these parameters mean:
| Parameter |
Value/Description |
Example |
| Formula Name: |
TRIX
|
FormulaFinancial(FinancialFormula.TRIX,"15","Series1:Y4","Series3:Y") |
| Input Value: | The value which represents the Close price. In the Dundas chart by default it is the fourth Y value in the stock chart. |
FormulaFinancial(FinancialFormula.TRIX,"15","Series1:Y4","Series3:Y") |
| Output Value: (optional) |
The TRIX indicator. If not specified output is stored in the first input value. |
FormulaFinancial(FinancialFormula.TRIX,"15","Series1:Y4","Series3:Y") |
|
Parameter: |
Periods property, used to determine a time period which is used in the TRIX formula. |
FormulaFinancial(FinancialFormula.TRIX,"15","Series1:Y4","Series3:Y") |
A line chart is a good choice when displaying a TRIX series.
Financial Interpretation: The TRIX indicator is designed to remove short and not very important cycles. With triple exponential smoothing TRIX filters out all cycles shorter than the specified number of periods.
The TRIX should be also used together with its Moving Average. When the TRIX rises above its Moving Average it is a buying signal. When the TRIX falls below its Moving Average it is a selling signal. The turning points can be identified by using divergence between the security and the TRIX.
Calculation: The TRIX indicator is calculated using the following formula:
- EMA1 = EMA( Close )
- EMA2 = EMA( EMA1 )
- EMA3 = EMA( EMA2 )
- TRIX = ( EMA3 [today] - EMA3 [yesterday] ) / EMA3 [yesterday]
Where:
EMA - Exponential Moving Average
Example
This example demonstrates how to calculate the TRIX.
| Visual Basic |  Copy Code Copy Code |
|---|---|
| |
| C# | Copy Code |
|---|---|
| |
 See Also
Financial Formulas
Formulas Overview
Using Financial Formulas