


Overview
When a non-default crossing value is used, then by default, an axis's labels and tick marks will move along the axis. This topic discusses crossing points, and provides coding examples.
Setting a Crossing Value at Design-Time
Follow these steps to set a crossing value for an axis at design-time:
- Open the ChartArea Collection Editor by clicking on the ChartAreas item in the Properties window.
- Select the Axes collection item in the ChartArea Collection Editor to open the Axis Collection Editor.
- Find a Crossing item in the Axis Collection Editor, and set the crossing value as shown in Figure 1 below.
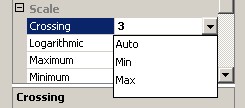
Figure 1: Setting the Crossing Property at Design-Time.
Crossing Property Modes
Four modes can be used for the crossing property of an axis:
-
Auto mode, which means that the crossing value will be set to the relevant axis's minimum or maximum value. If the axis is a primary axis, then the value set in this mode will be its minimum value. However, if the axis is a secondary axis, then the value set while in this mode will be its maximum value. To programmatically set to Auto mode at run-time, use the value Double.Nan.
-
Minimum mode, which means the axis's crossing value will be its minimum value. To set to Minimum at run-time, use a Double.MinValue value.
-
Maximum mode, which means the axis's crossing value will be its maximum value. To set to Maximum at run-time, use a Double.MaxValue value.
-
A specified double value that must be between the relevant axis's Minimum and Maximum value as shown in the Figure 2 below. If the crossing value is less than the minimum value, or the crossing value is greater than maximum value an exception will be thrown.
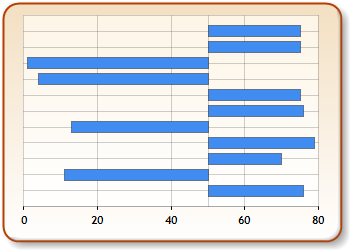
Figure 2: Setting the Crossing property to 50.
Code Samples
These code examples have been included to demonstrate various techniques used with crossing points.
Example
This example demonstrates how to set the crossing point to an explicit value, and create a chart similar to the one shown in Figure 2 above. We assume that a series named "Series1" has been added at design-time, and that the series has had 3 data points added to it.
| Visual Basic |  Copy Code Copy Code |
|---|---|
| |
| C# | Copy Code |
|---|---|
| |
Axis Labels Tick Marks and Crossing Points
The labels and tick marks of an axis will, by default, move along the axis if the crossing value is set to a non-default value. This behavior can be changed by setting the MarksNextToAxis property to False, in which case the axis labels and tick marks will stay fixed within the ChartArea object. This next sample demonstrates how to use this MarksNextToAxis property:
Example
In this example we demonstrate how to set the crossing point to an explicit value, and we create a chart similar to the one shown in Figure 3 below. We assume that a series named "Series1" has been added at design-time, and that the series had 3 data points added to it. Further, we assume that the DundasBlue template has been applied to the original chart for appearance purposes.
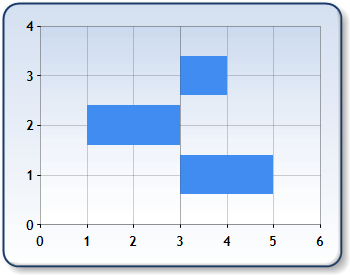
Figure 3: Setting crossing points.
| Visual Basic | Copy Code |
|---|---|
| |
| C# | Copy Code |
|---|---|
| |
 See Also
How To
Axis Types